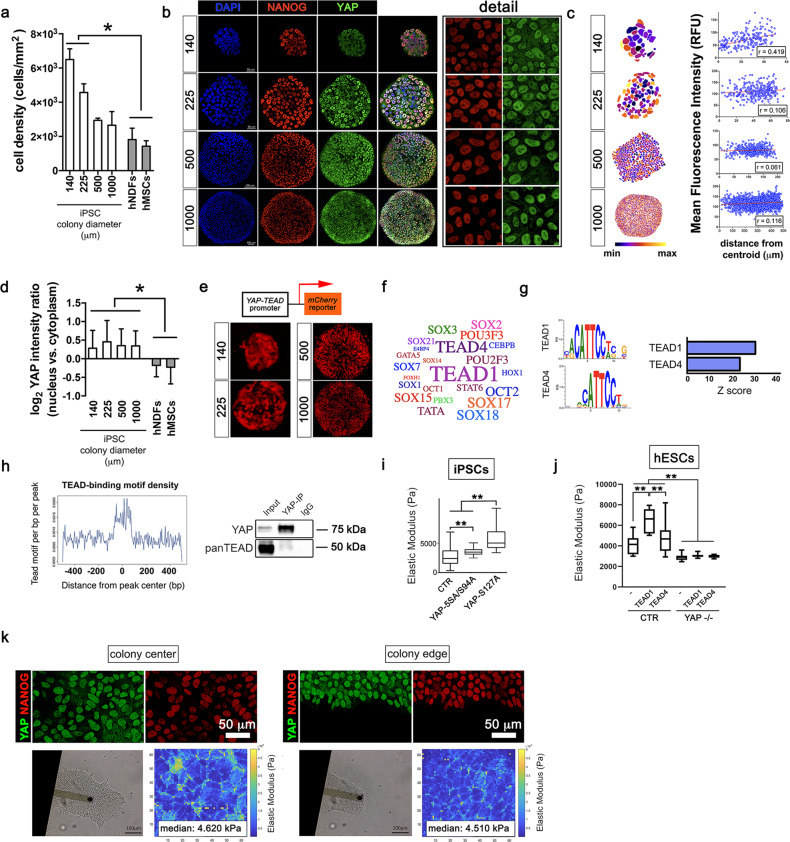
Fig. 1. YAP–TEAD1 transcriptional activity controls pluripotent stem cell mechanical properties regardless of contact inhibition.
a Barplot representation of the quantification of cell density in iPSCs grown onto micropatterned surfaces with the indicated diameters (μm), high density hMSCs and hNDFs. Values are expressed as means ± SD (n = 6, *P < 0.05, one-way ANOVA followed by Holm-Sidak’s multiple comparisons test). b Representative confocal images (n = 10) depicting YAP (green) and NANOG (red) expression in iPSCs grown onto micropatterns of the given diameters (μm). c Quantification of YAP distribution within the micropatterned colonies of controlled diameter as quantified by image analysis and expressed as the Pearson’s product moment correlation coefficient (n(140 ⌠m) = 19; n(225 ⌠m) = 9; n(500 ⌠m) = 9; n(1000 ⌠m) = 6). d Barplot representation of the quantification of YAP nucleus/cytoplasm intensity ratio in iPSCs grown onto micropatterned surfaces with the indicated diameters (μm), high-density hMSCs and hNDFs. Values are expressed as means ± SD (n = 6, *P < 0.05, one-way ANOVA followed by Holm-Sidak’s multiple comparisons test). e Representative confocal images of YAP–TEAD-mCherry reporter hESC line cultured onto micropatterns with the indicated diameters (μm) (n = 3). f wordcloud representation of the most significantly represented transcription factors known to bind the sequences identified as YAP targets by ChIP-seq analysis. Font size correlates inversely to −log10(P value). g Left: motif analysis identification of enriched YAP ChIP-seq peaks with the relative statistical significance. Right: barplot representation of enriched YAP ChIP-seq peaks with the relative statistical significance. h Left: graphical representation of TEAD-binding motif density within a 500-bp distance from YAP ChIP-seq peak. Right: western blot analysis for anti-YAP and -panTEAD antibodies in iPSCs immunoprecipitated for YAP endogenous protein. Input and IgG were used as positive and negative controls, respectively (n = 3). i Boxplot representation of the Elastic Modulus (or Young’s Modulus) of single iPSCs transfected with GFP (day 0) or co-transfected with GFP and either YAP-S127A or YAP-5SA/S94A mutants, as obtained by Atomic Force Microscope (AFM) analysis. Values are shown as median ± min/max (n = 12, **P < 0.01, Kruskal–Wallis test followed by post hoc Dunn’s test for multiple comparison). j Boxplot representation of the data obtained by analyzing the Elastic Modulus of single CTR or YAP−/− hESCs transfected with GFP (−) or co-transfected with GFP and either TEAD1 or TEAD4. Values are shown as median ± min/max (n = 12, **P < 0.01, Kruskal–Wallis test followed by post hoc Dunn’s test for multiple comparison). k Top: representative confocal images of NANOG (red) and YAP (green) expression at the centre or at the edge of hESC colonies (n = 3). Bottom: bright-field images of AFM cantilever contacting cells at hESC colony centre or edge and the respective Elastic modulus maps obtained from the measurement.

