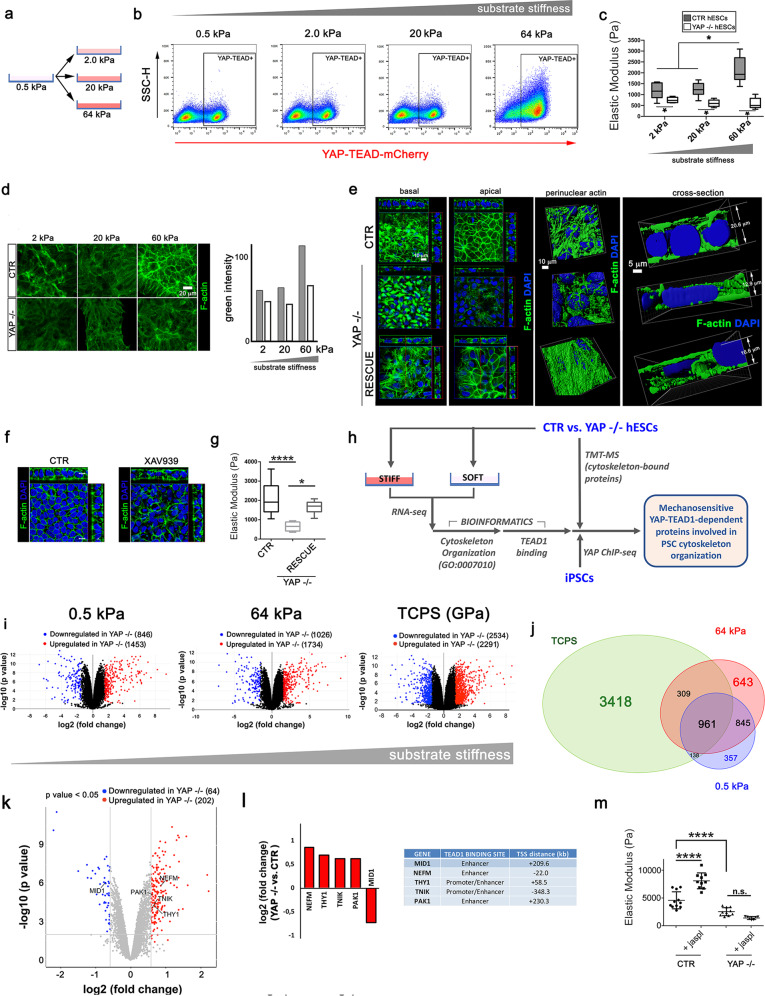
Fig. 3. YAP–TEAD1 acts downstream of substrate stiffness to transcriptionally control cytoskeleton-related genes and PSC mechanics.
a Graphical representation of the experimental setup used to assess pluripotent stem cell (PSC) response to changes in physiological substrate stiffness. YAP–TEAD-mCherry hESC reporter cells were cultured onto soft surface (0.5 kPa) and then moved to surfaces with increasing stiffness (2, 20 and 64 kPa). b Representative FACS plots depicting mCherry fluorescence in YAP–TEAD-mCherry hESC reporter cells cultured for 48 h on substrates with physiological stiffness (n = 3). c Boxplot representation of the Elastic Modulus of CTR and YAP−/− hESCs grown onto substrates with increasing stiffness (2, 20 and 60 kPa). The values were obtained by AFM and are expressed as Pascal (Pa) (n = 12, *P < 0.05, one-way ANOVA test followed by Holm-Sidak’s test for multiple comparison). d Left: representative confocal images depicting F-actin (green) cytoskeleton arrangement in isogenic (CTR) and YAP−/− hESCs (YAP−/−) grown onto substrates with increasing physiological stiffness. Right: barplot representation of the intensity of green channel (F-actin) in isogenic (CTR) and YAP−/− hESCs (YAP−/−) grown onto substrates with increasing physiological stiffness (n = 3). e Left: orthogonal sections from Z-stack confocal images showing the basal (left) and apical (right) distribution of F-actin in CTR, YAP−/− and YAP −/− hESCs in which YAP has been re-expressed (RESCUE). F-actin is stained with Phalloidin (green) and nuclei counterstained with DAPI (blue). Side views show sagittal sections of the monolayered cells. Right: 3D Z-stack reconstruction and cross-sectional view of the perinuclear actin of CTR, YAP−/− and RESCUE hESCs (n = 3). The images were obtained by IMARIS software after staining with Phalloidin (F-actin, green) and DAPI (nuclei, blue). f Orthogonal sections from Z-stack confocal images showing F-actin organization (green) in CTR and XAV939-treated hESCs for 48 h. Side views show sagittal sections of the monolayered cells. F-actin was stained with Phalloidin (green) and nuclei were counterstained with DAPI. g Boxplot representation of the elastic modulus of CTR, YAP−/− and RESCUE hESCs (n = 12, ****P < 0.0001; *P < 0.05, Kruskal–Wallis test followed by post hoc Dunn’s test for multiple comparisons). h Schematic representation of the strategy followed to discover proteins involved in cytoskeleton organization which are regulated by substrate stiffness through YAP in pluripotent stem cells (PSCs). i Volcano plot representation of differentially regulated genes in CTR versus YAP−/− hESCs grown on substrates with physiological (0.5 and 64 kPa) and tissue culture polystyrene (TCPS). (n = 3, P < 0.05, log2 Fc < |0.58|). j Venn diagram representation of differentially regulated genes in CTR versus YAP−/− hESCs grown on substrates with physiological (0.5 and 64 kPa) and tissue culture polystyrene (TCPS). k Venn diagram representation of PSC YAP bona fide targets that have an annotation for cytoskeleton organization (GO: 0007010) and found dysregulated onto substrate with controlled stiffness (0.5 and 64 kPa) and Tissue culture polystyrene (TCPS). l Volcano plot representation of cytoskeleton-bound proteins significantly regulated in YAP−/− compared to CTR hESCs, as identified by TMT Mass Spectrometry. (n = 5, P < 0.05, log2 Fc > |0.58|). l Left: barplot representation of cytoskeleton-bound proteins significantly regulated in YAP−/− compared to CTR hESCs, as identified by TMT mass spectrometry, that were defined as YAP bona fide targets with cytoskeleton annotation (GO:0007010). Right: identification of TEAD1-binding sites in selected YAP targets with cytoskeleton organization annotation. m Dotplot representation of elastic modulus in CTR and YAP−/− hESCs treated or not with F-actin polymerizing agent jasplakinolide for 24 h as obtained by AFM analysis. (n = 12, ****P < 0.0001, Kruskal–Wallis test followed by post hoc Dunn’s test for multiple comparisons).

