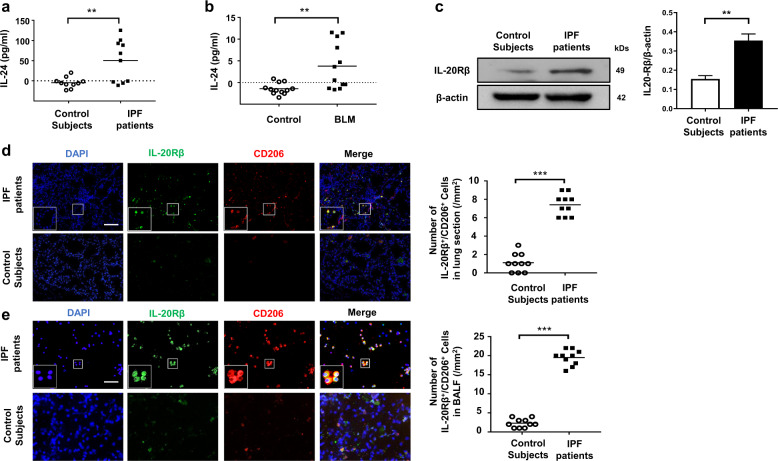
Fig. 1. Analysis of IL-24 expression in IPF patients and in BLM-induced mice.
a ELISA analysis of IL-24 levels in the serum from IPF patients and healthy subjects. A total of ten IPF patients and ten control subjects were analyzed. Results are shown as the median; each dot represents one patient. The dotted line indicates the detection limit. Statistical analysis was performed using the Student’s t test (**p < 0.01). b ELISA analysis of IL-24 levels in the BALF of mice following 21 days of BLM induction. Twelve mice were analyzed in each group. Each dot represents an animal, and the median is presented. The dotted line indicates the detection limit. Statistical analysis was performed using the Student’s t test (**p < 0.01). c Western blot analysis of IL-20Rβ expression in the lung homogenates derived from IPF patients and control subjects. Left panel: a representative Western blot result. Right panel: a bar graph showing the mean data for five IPF patients and five control subjects analyzed. Statistical analysis was performed using the Student’s t test (**p < 0.01). d Representative results for co-immunostaining of IL-20Rβ and CD206 (an M2 macrophage marker) in the lung sections from patients with IPF and healthy subjects. The nuclei were stained blue by DAPI, Scale bar, 50 μm. A total of ten IPF patients and ten control subjects were analyzed. Scatter plot indicates the IL-20Rβ+/CD206+ cell count (numbers/mm2) in the lung sections from IPF patients and healthy subjects; each dot represents a patient. Statistical analysis was performed using the Student’s t test (***p < 0.001). e Representative results for co-immunostaining of IL-20Rβ and CD206 (an M2 macrophage marker) in the BALF from patients with IPF and healthy subjects. The nuclei were stained blue by DAPI, Scale bar, 50 μm. A total of ten IPF patients and ten control subjects were analyzed. Scatter plot indicates the IL-20Rβ+/CD206+ cell count (numbers/mm2) in the BALF from IPF patients and healthy subjects; each dot represents a patient. Statistical analysis was performed using the Student’s t test (***p < 0.001). BLM bleomycin, IPF idiopathic pulmonary fibrosis.

