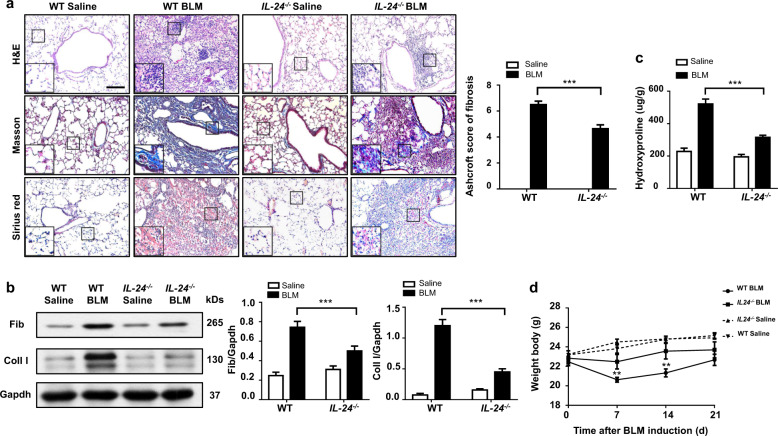
Fig. 2. Loss of IL-24 attenuates lung injury and fibrosis.
a Histological analysis of the severity of lung fibrosis in mice after BLM induction. Left panel: representative results for H&E (top), Masson (center), and Sirius red (bottom) staining. The insets show higher magnification images for a particular location. Right panel: a bar graph showing the semiquantitative Ashcroft scores for the severity of fibrosis, Scale bar, 50 μm. Error bars represent means ± SEM (n = 12). Statistical analysis was performed using one-way ANOVA (***p < 0.001). b Western blot analysis of the fibrotic markers collagen I and fibronectin. Left panel: a representative Western blot result. Right panel: a bar graph showing the mean data for all mice analyzed in each group. Error bars represent means ± SEM (n = 12). Statistical analysis was performed using one-way ANOVA (***p < 0.001). c Bar graph showing the quantification of hydroxyproline content in the lungs of mice after BLM induction. Error bars represent means ± SEM (n = 12). Statistical analysis was performed using one-way ANOVA (***p < 0.001). d Body weight changes during the course of BLM-induced fibrosis. Error bar represents the mean ± SEM of 12 mice analyzed. Statistical analysis was performed using one-way ANOVA (**p < 0.01). BLM bleomycin, Coll I collagen I, Fib fibronectin, WT wild type.

