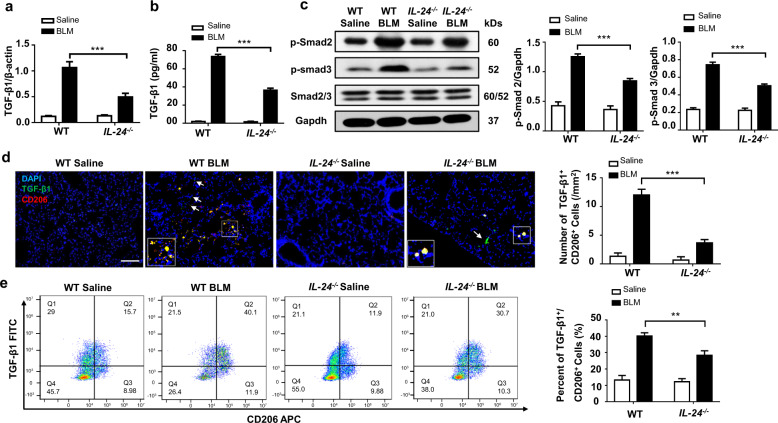
Fig. 3. Loss of IL-24 attenuates TGF-β1 signaling after BLM induction.
a RT-PCR analysis of TGF-β1 expression in the lung homogenates. b ELISA results for TGF-β1 levels in the BALF. Error bar represents the mean ± SEM of 12 mice analyzed. Statistical analysis was performed using one-way ANOVA (***p < 0.001). c Results for Western blot analysis of TGF-β1 and downstream Smad2 and 3 activities. Left panel: a representative Western blot result for Smad2/3, p-Smad2, and p-Smad3 in the lung homogenates. Right panel: a bar graph showing the results for all mice examined. Error bar represents the mean ± SEM of 12 mice analyzed. Statistical analysis was performed using one-way ANOVA (***p < 0.001). d Co-immunostaining of TGF-β1 and CD206 in the lung sections. Scale bar, 50 μm. The white arrows indicate TGF-β1+/CD206− cells in the lung sections. Error bar represents the mean ± SEM of 12 mice analyzed. Statistical analysis was performed using one-way ANOVA (***p < 0.001). e Flow cytometry analysis of TGF-β1 and CD206 expression in the lung single-cell suspensions in both BLM induced WT and IL-24−/− mice. Left panel: a scatter diagram for flow cytometry analysis. Right panel: a bar graph showing the data with five mice examined, the cells were first gated in F4/80 and CD11b, and then subjected to analysis of TGF-β1-FITC and CD206-APC expressions. Error bar represents the mean ± SEM of five mice analyzed. Statistical analysis was performed using one-way ANOVA (**p < 0.01). BALF bronchoalveolar lavage fluid, BLM bleomycin, TGF-β1 transforming growth factor β1.

