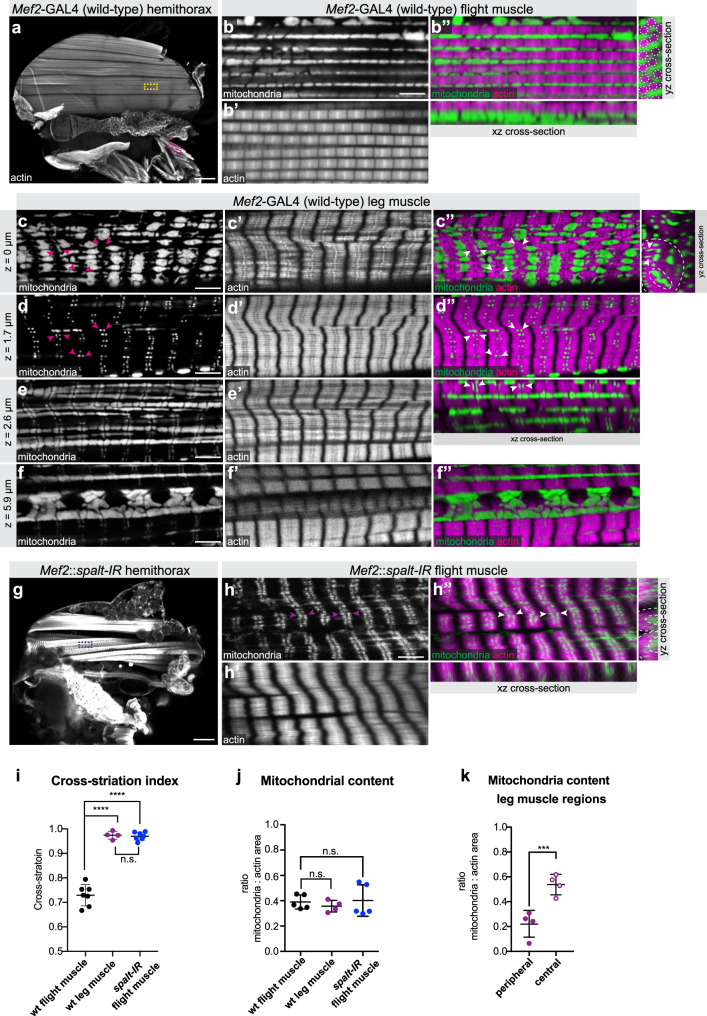
Fig. 1. spalt regulates muscle type-specific mitochondria morphogenesis.
a–f Mef2-GAL4 (wild type) hemithorax (a), flight muscle (b) and leg muscle (c–f) stained with phalloidin to visualise actin (magenta) and expressing mito-GFP to visualise the mitochondrial matrix (green). Yellow and magenta boxes in a indicate representative regions of flight and leg muscles magnified in b–f. Single confocal plane as well as and xz yz cross-sections are shown (b″). Note the individualised myofibrils (dotted circles) surrounded by densely packed mitochondria. c–f Leg muscle top (c), middle (d, e) and central slice (f) showing the tubular fibre morphology (yz cross-section), cross-striated myofibrils and complex mitochondrial shapes filling the surface and the centre of the myofiber and contacting the sarcomeric I-bands with thin extensions (magenta and white arrow heads). g, h Mef2::spalt-IR hemithorax (g) and flight muscle (h) display tubular fibre morphology (h″ yz cross-section), cross-striated myofibrils and centrally located mitochondria with thin extension towards the I-bands (arrow heads). i–k Quantification of the lateral fibrillar alignment called cross-striation index in muscle (i; n = 6, 4, 6 animals respectively see Supplementary Fig. 1), the relative mitochondria content (j, relative to myofibril content; n = 5, 4, 5 animals respectively) and the mitochondria content in leg muscle regions (k; n = 4). Dotted lines on the yz cross-sections of c″ and h″ represent the regions measured. Note that higher mitochondria density in the centre of leg muscles. In all plots, individual circles represent individual animals, for each a minimum of five measurements was done, and mean ± standard-deviation (SD) is indicated. Significance from two-tailed unpaired t-tests is denoted as p-values ***p ≤ 0.001 or ****p ≤ 0.0001. (n.s.) non-significant. Scale bars are 100 µm (a, g) and 5 µm (b, c–f, h).

