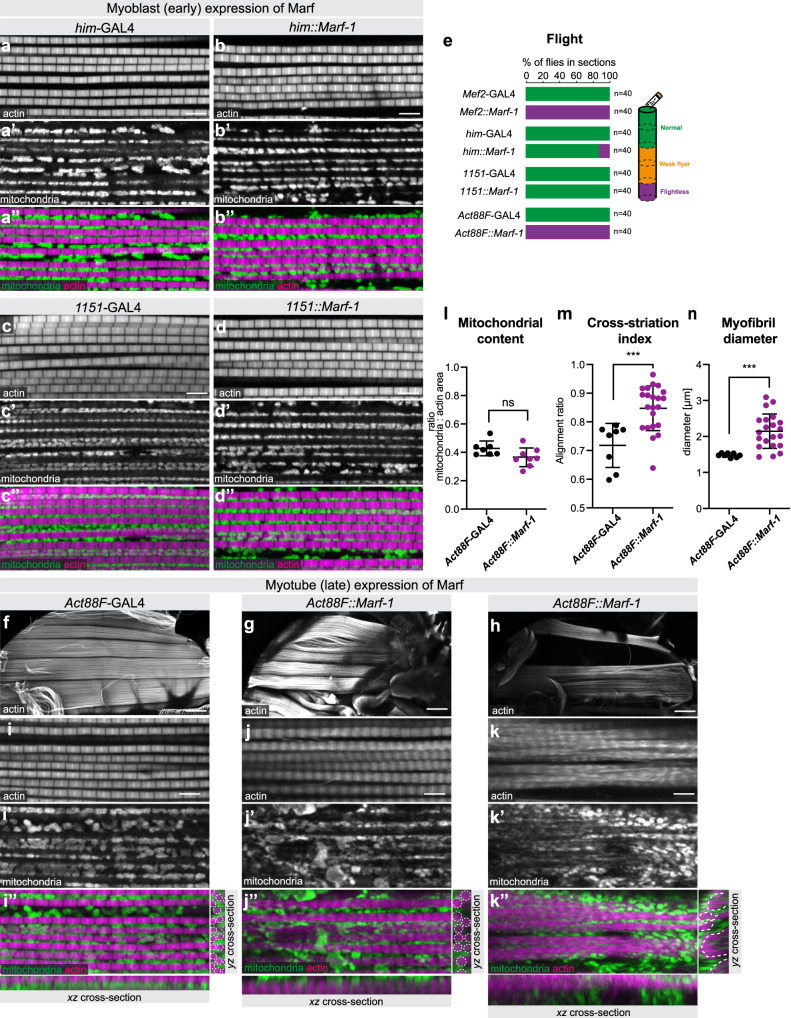
Fig. 6. Developmental timing of mitochondrial dynamics impacts myofibril development.
a–e Wild-type adult control (a, c) and early over-expression of Marf-1 with him-GAL4 (b) or 1151-GAL4 (d) flight muscles were stained with phalloidin and anti-complex V antibody to visualise myofibrils and mitochondria. Note the normal myofibril and mitochondria morphologies (b, d), which support flight (e). f–n Wild-type control (f) and Act88F::Marf-1 hemi-thoraces (g, h), as well as flight muscles (i–k) expressing Marf-1 during later developmental stages were stained with phalloidin and anti-complex V antibody to visualise myofibrils and mitochondria. Two representative phenotypes of Act88F::Marf-1 flight muscles are shown, displaying either thicker myofibrils (indicated by white dashed outline in the cross-section) (j) or partially cross-striated myofibrils (k). Mitochondria are largely excluded from myofibrillar bundles in Act88F::Marf muscles (see dashed white outline of the myofibril-rich areas in k″). l–n Quantification of the Act88F::Marf flight muscle phenotypes, quantifying mitochondrial content (l; n = 7 and 8 animals, respectively), cross-striation index (m; n = 8 and 21 animals, respectively) and myofibril diameter (n; n = 8 and 21 animals, respectively). In all plots the mean ± standard-deviation (SD) is indicated and significance from two-tailed unpaired t-tests is denoted as ***p-values ≤ 0.001. n.s. non-significant. Scale bars are 5 µm (a–d, i–k) and 100 µm (f–h).

