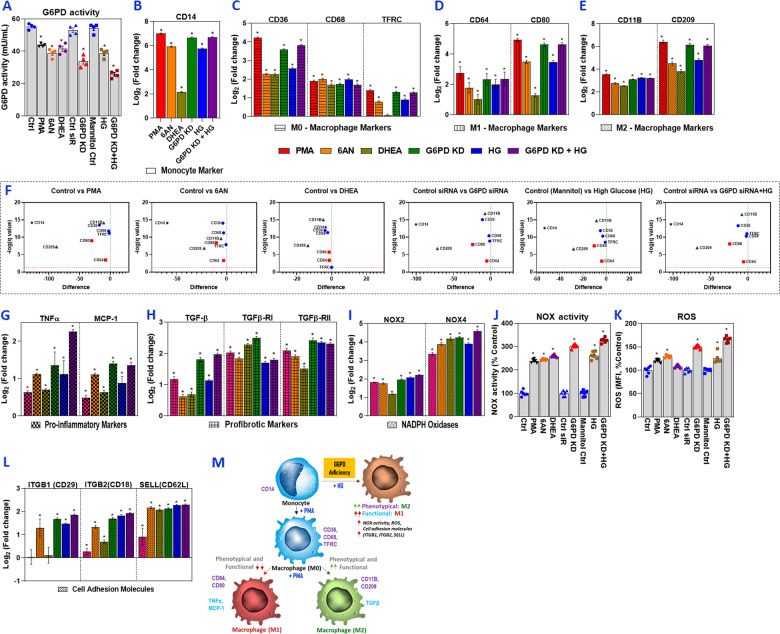
Fig. 1.
G6PD deficiency activates monocytes and their effect on functional and phenotypical M1/M2 macrophage polarization. Human monocytes/macrophages (SC cells) were treated with PMA (150 nM for 48 h), G6PD inhibitors (6AN/DHEA; 100 µM for 24 h), or G6PD siRNA (100 nM for 24 h). G6PD-normal (control) and G6PD-deficient cells were then exposed to high glucose (HG; 25 mM) for an additional 24 h. For PMA and G6PD inhibitors, normal cells were used as a control, and control siRNA served as a control for G6PD-siRNA-treated groups. For cells treated with HG, mannitol was used as an osmolarity control. a G6PD activity. RT-qPCR was performed to assess the level of target genes as indicated; the data are presented as log base twofold change over the respective controls (b–e). b Monocyte marker (CD14). c M0 macrophage markers (CD36, CD68, and TFRC/CD71). d M1 macrophage markers (CD64 and CD80). e M2 macrophage markers (CD11B/ITGAM and CD209). f Multiple Student’s t tests were used to analyze control vs. treated conditions; volcano plots with false discovery rate (FDR) were created using the two-stage linear step-up procedure of Benjamini, Krieger, and Yekutieli with Q = 1%. g mRNA levels of proinflammatory markers (TNFα and MCP-1). h mRNA levels of profibrotic markers (TGF-β1, TGF-βR1, and TGF-βR2). i mRNA levels of NADPH oxidase (NOX2 and NOX4). j NOX activity. k ROS levels. l mRNA levels of cell adhesion molecules (ITGB1/CD29, ITGB2/CD18, and SELL(CD62L)). m Schematic illustration of the proposed mechanism of glucose-6-phosphate dehydrogenase (G6PD) deficiency-induced human monocyte/macrophage activation/polarization. The results are shown as the mean ± SEM (n = 3–6). An asterisk indicates significance. The p values were calculated with ANOVA, followed by Dunnett’s post hoc test (*p < 0.05)

