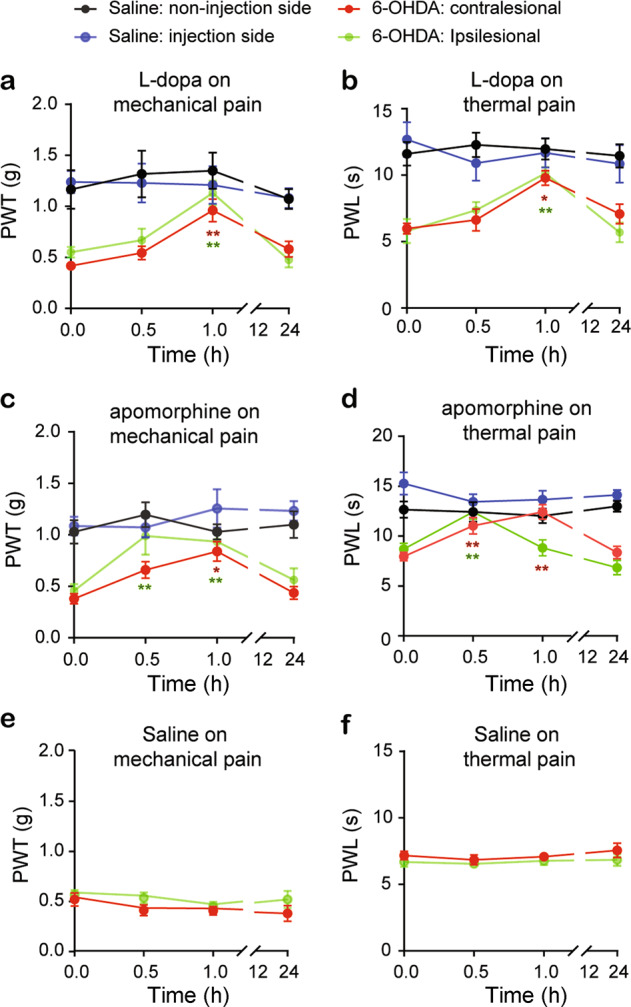
Fig. 4. Dopamine receptor agonists attenuate mechanical and thermal pain hypersensitivity in the unilateral 6-OHDA-lesioned mice.

A single intrathecal injection of L-dopa (a, b), apomorphine (c, d) or saline (e, f) in the saline mice or unilateral 6-OHDA-lesioned mice. PWT and PWL in both hindpaws were measured in separate experiments before (0) and 0.5, 1 and 24 h after injection. Two-way ANOVA was used to analyze the data in (a–f). a n = 8 mice; Group: F (3, 109) = 24.23, P < 0.0001; Time point: F (3, 109) = 6.49, P = 0.0004; Interaction: F (9, 109) = 1.29, P = 0.25. b n = 6–7 mice; Group: F (3, 88) = 31.13, P < 0.0001; Time: F (3, 88) = 4.49, P = 0.0056; Interaction: F (9, 88) = 1.74, P = 0.093. c n = 7 mice; Group: F (3, 106) = 23.89, P < 0.0001; Time: F (3, 106) = 5.46, P = 0.0016; Interaction: F (9, 106) = 1.67, P = 0.1. d n = 9 mice; Group: F (3, 124) = 34.87, P < 0.0001; Time: F (3, 124) = 3.92, P = 0.01; Interaction: F (9, 124) = 5.3, P < 0.0001. e n = 7 mice; Group: F (1, 62) = 4.24, P = 0.05; Time: F (3, 62) = 1.52, P = 0.22; Interaction: F (3, 62) = 0.35, P = 0.79. f n = 7 mice; Group: F (1, 62) = 3.27, P = 0.075; Time: F (3, 62) = 0.61, P = 0.61; Interaction: F (3, 62) = 0.13, P = 0.94. *P < 0.05, **P < 0.01, compared with baseline. Asterisks in red or green represent comparisons with their own baseline.
