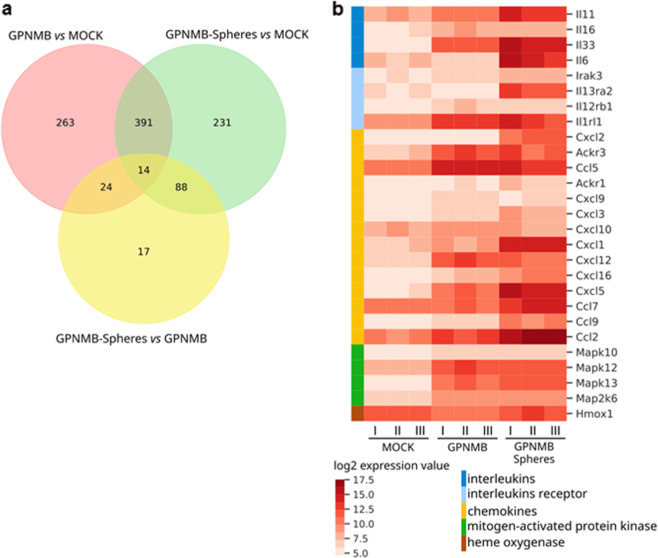
Fig. 5.
GPNMB activates the expression of several genes and survival pathways. a, b Gene expression analysis of the MCA-1-mock cells, MCA-1-GPNMB cells and their derived spheres. a Venn diagram of differentially expressed genes in three comparisons: MCA-1-GPNMB cells versus MCA-1-mock cells in pink; GPNMB-spheres versus MCA-1-mock cells in green; GPNMB-spheres versus MCA-1-GPNMB cells in yellow. Intersections indicate genes in common in the compared groups. b Heatmap of log2 expression values related to the set of genes indicated in the color legend. Genes are indicated in the rows, and samples are indicated in the columns, with three replicates per group (I, II, III)

