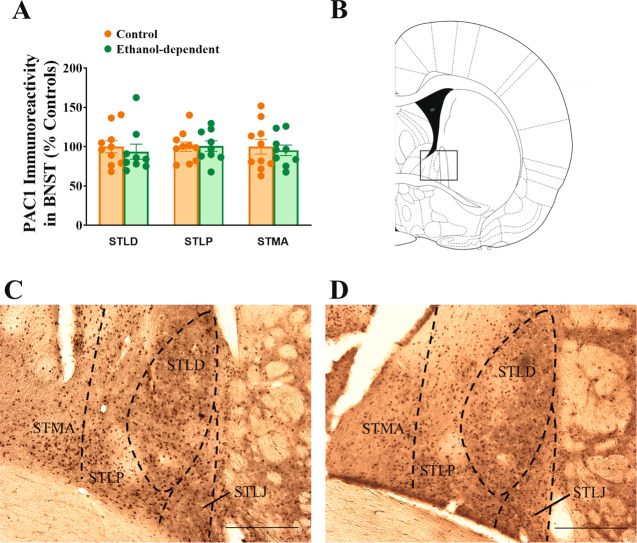
Fig. 2. Effect of chronic intermittent exposure to ethanol vapors on PAC1R-positive cell bodies in the BNST 8–10 h after vapor offset.
No difference was found between groups (A). Drawing of a coronal rat brain slice representing the area analyzed (B). Representative pictures of PACAP immunohistochemistry in control, nondependent and in ethanol-dependent rats (C–D). STMA BNST medial-anterior, STLP BNST lateral-posterior, STLD BNST lateral-dorsal, STLJ BNST lateral-justacapsular. Scale bars represent 250 μm. Control and ethanol-dependent rats are depicted in orange and green, respectively. Data represent Mean ± SEM (n = 9–10/group).

