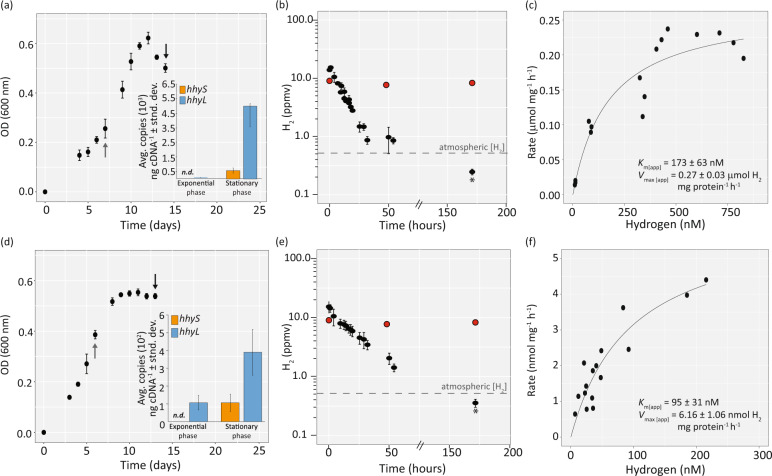
Fig. 4. Expression, activity, and kinetics of the enzymes mediating atmospheric H2 oxidation in two acidobacterial strains isolated from temperate soils, Acidobacteriaceae bacterium KBS 83 and Edaphobacter aggregans.
a, d Growth curves of the strains over time (days) (x-axis) and expression levels (inset) of the group 1h [NiFe]-hydrogenase structural subunit genes (large, hhyL; small, hhyS) during exponential and stationary phase. Arrows depict the growth phases in which cells were harvested for gene expression investigations (gray arrow, exponential phase; black arrow, stationary phase). During this experiment, H2 consumption was measured on stationary phase cells (black arrows) and in a parallel experiment on exponential phase cells (Fig. S13), as H2 consumption assays required the entire biomass of such an experiment. b, e H2 consumption of stationary phase stage cells of each respective strain; x-axis depicts the start of measurements for H2 consumption after harvesting cells from growth curves of panels a, d. Dashed lines represent atmospheric H2 concentrations (~0.53 ppmv), whereas red points depict the heat-killed controls for each respective strain. The final sub-atmospheric H2 measurement for each strain was performed on a gas chromatograph with a pulsed discharge helium ionization detector (model TGA-6791-W-4U-2, Valco Instruments Company Inc.); this measurement is indicated by an asterisk. Over the course of the experiment, we observed a slight decrease in H2 for our medium control (8%). Even when this loss is accounted for in the final sub-atmospheric measurement, the concentration is still below atmospheric levels of H2, (0.27 ppmv for Acidobacteriaceae bacterium KBS 83 and 0.39 ppmv for E. aggregans). Additional controls can be found in Fig. S3. c, f Apparent kinetic parameters of H2 oxidation for the strains based on whole-cell assays. Best-fit curves were determined using the Michaelis–Menten non-linear regression model; similar values were observed using Hanes–Woolf plots (Table S5).

