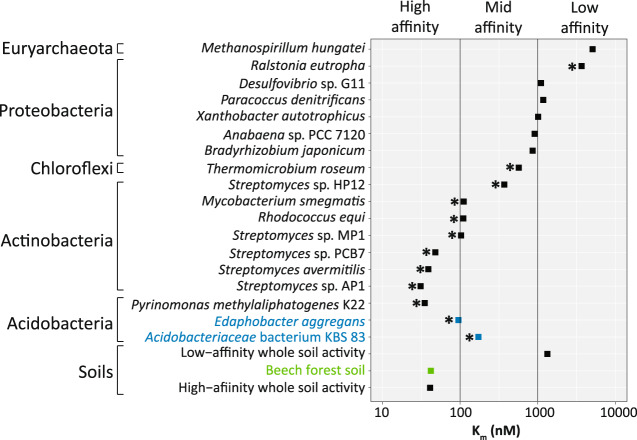
Fig. 5. Comparison of apparent substrate affinity (Km[app], in nM) for H2-oxidizing bacteria and archaea spanning different taxonomic groups.
Figure was amended from [17]; data were extracted from Greening et al. [17] and Islam et al. [22]. Asterisks depict microorganisms harboring a group 1h [NiFe]-hydrogenase. Acidobacteria estimates derived in this study are depicted in blue, and data from the investigated beech forest soil are shown in green.

