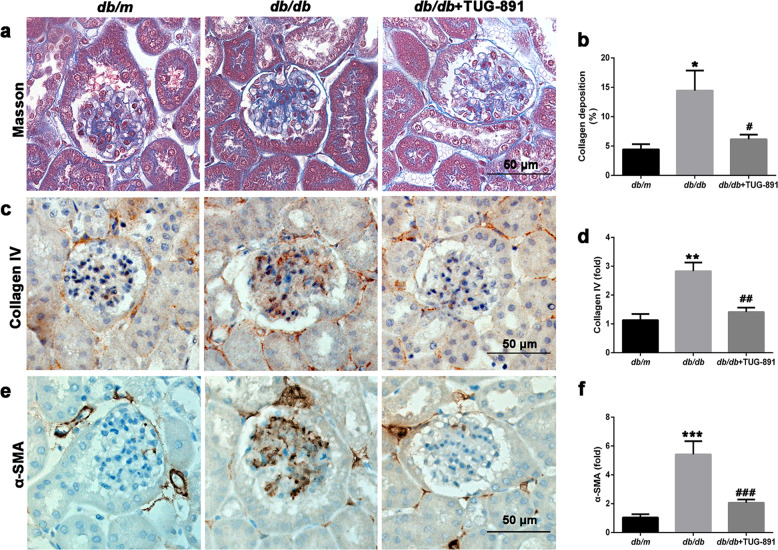
Fig. 3. Activation of GPR120 by TUG-891 ameliorated renal fibrosis in db/db mice.
Representative images (a) and quantification (b) of collagen disposition (%) in Masson-stained kidney sections. Magnification: ×400. IHC staining for c collagen IV and e α-SMA in db/m, db/db, and TUG-891-treated db/db mice. d, f Quantification of the areas (%) of collagen IV- and α-SMA-positive cells in the glomeruli. *P < 0.05, **P < 0.01, ***P < 0.001 compared with db/m mice; #P < 0.05; ##P < 0.01, ###P < 0.001 compared with db/db mice.

