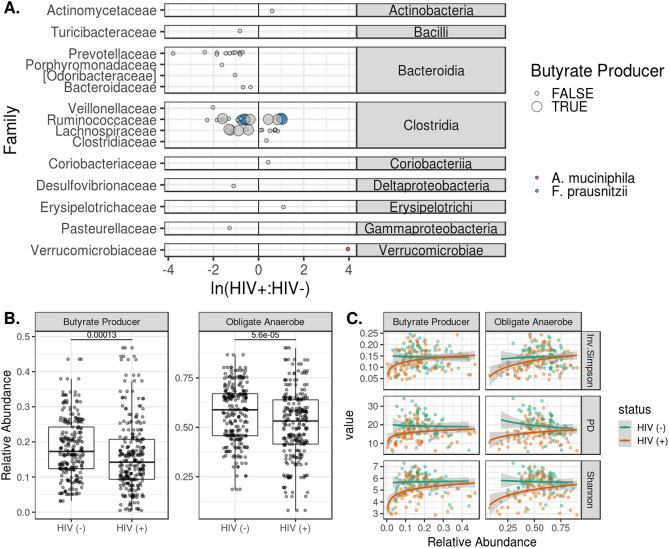
Figure 4.
Differential abundance of ASVs and microbiome function by HIV status. Differentially represented ASVs in the HIV infected and HIV non infected cohorts were identified via paired, Wilcoxon tests. Mean relative abundances were calculated for these ASVs for the HIV-negative and positive cohorts. In (A), the log-ratio of those mean abundances are plotted on the x axis, with ASVs more abundant in the HIV infected cohort having a ratio greater than 0. ASVs are grouped at the class level, and the family-level taxonomic assignment is given on the y axis. ASVs that were predicted to produce butyrate are shown as large circles, while small circles donate ASVs that are not capable of butyrate production. ASVs mapped to A. muciniphila and F. prausnitzii are colored red and blue, respectively. ASVs with genus-level taxonomic assignments were filtered against the “List of Prokaryotes according to their Aerotolerant or Obligate Anaerobic Metabolism” and were assigned a binary value for predicted butyrate production and obligate anaerobic growth. Relative abundances for ASVs predicted to have these traits are shown in (B). There were differing relative abundances of butyrate producers and obligate anaerobes by HIV status (p < 0.001). (C) Depicts the log-linear relationships between the relative abundance of these traits and the corresponding alpha diversity (p < 0.001).

