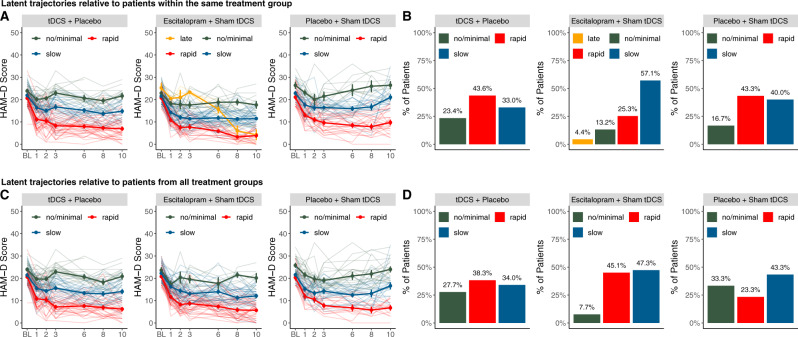
Fig. 1. Distinct trajectories of change in depressive symptoms over 10 weeks of treatment with tDCS + placebo, escitalopram + sham tDCS, and placebo + sham tDCS.
a HAM-D score change in latent trajectories relative to patients within the same treatment group until week 10; error bars represent ±1 standard error (b) distribution of trajectory classes within each treatment arm (c) HAM-D score change in latent trajectories relative to patients from all treatment groups (d) comparing distributions of trajectory classes between treatment arms; Trajectory classes were determined using growth mixture modeling; optimal combinations of class number and polynomial degree were determined using log Bayes factor approximation >10 as criterion for favouring a more complex model. (Figure embedded for readability, source files submitted separately).

