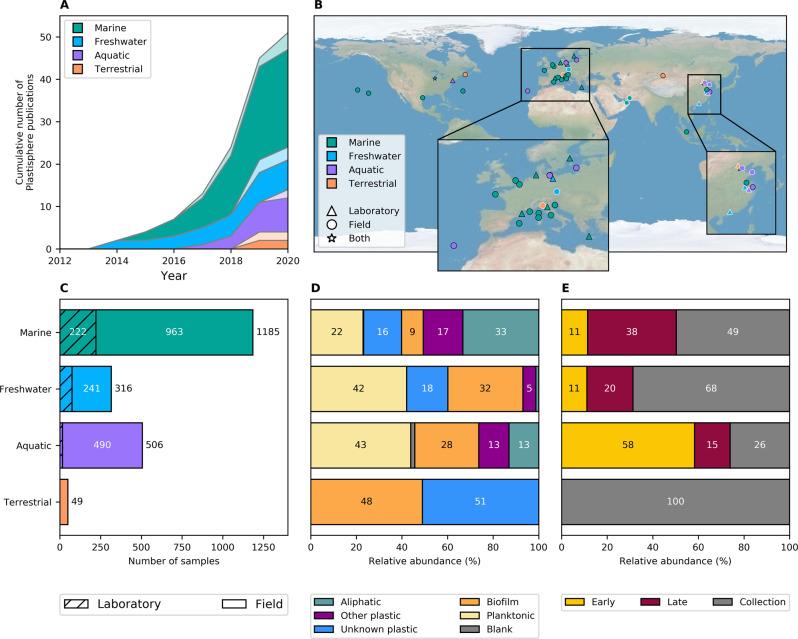
Fig. 1. Overview of the studies and samples included in the meta-analysis.
Cumulative number of studies per year (A), study location (B), number of samples (C), relative abundance of sample type (D), and sample incubation time (E) for studies carried out in the marine, freshwater, other aquatic, and terrestrial environments. A, B Show all 50 studies whereas, C, D, and E show only studies/samples that were included. Studies for which data were not provided (neither publicly available nor provided upon request) are shown with transparent colors in A and white marker edges in B. Note that those studies shown for 2020 were already in press and available online by 5 January, 2020. See Supplementary Tables S1 and S2 for full details of all studies and samples included.

