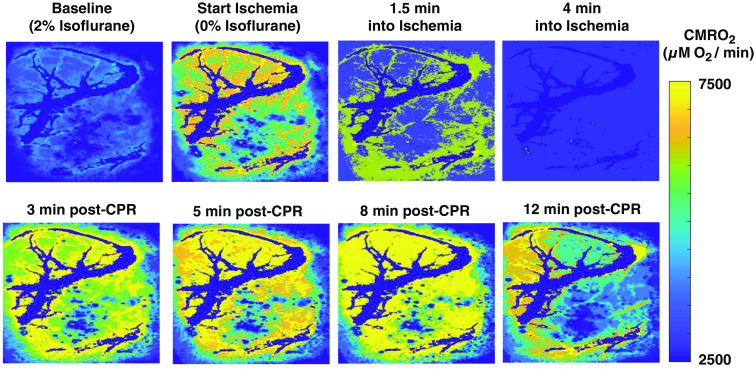
Fig. 3.
Absolute () maps of a region of the rat brain at different time points during a CA/CPR experiment. Metabolic activity increases as anesthesia is being washed out (between “baseline” and “start ischemia”), followed by a sharp decrease during ischemia. Following CPR, recovers to anesthesia-free baseline level (3 min post-CPR), subsequently increases to values higher than baseline (5 to 8 min post-CPR), and then declines to values approaching anesthetized baseline level once cerebral electrical activity resumes (12 min post-CPR). Large vessels (dark blue) have been removed from the images to signify that the oxygen metabolism we are measuring is occurring in the parenchyma.

