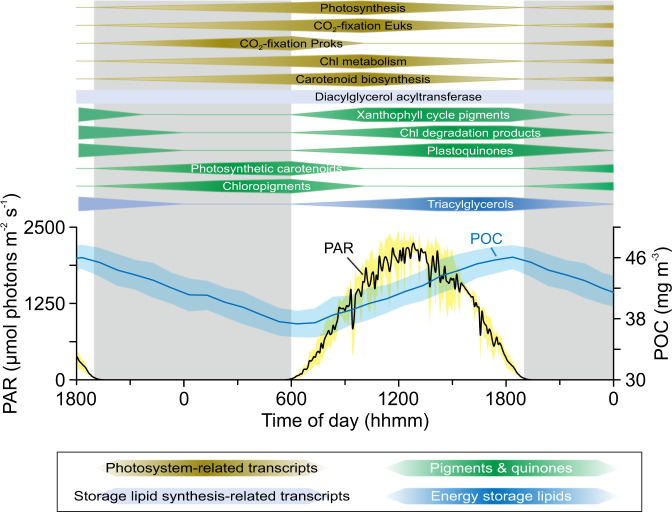
Fig. 4. Conceptualized temporal separation of phytoplankton pigment, plastoquinone and transcript abundances during the dark–light cycle in surface waters (15 m) at station ALOHA.
The timing was set based on Fig. 2 with the center of the polygon indicating the approximate peak time. In addition, the particulate organic carbon (POC) and photosynthetically available radiation (PAR) profiles averaged for one day/night cycle are shown. Surface PAR data were obtained from the HOT program database (http://hahana.soest.hawaii.edu/hoelegacy/hoelegacy.html), POC data from White et al. [105] and TAG (triacylglycerols & diacylglycerol acyltransferase) data from Becker et al. [19].

