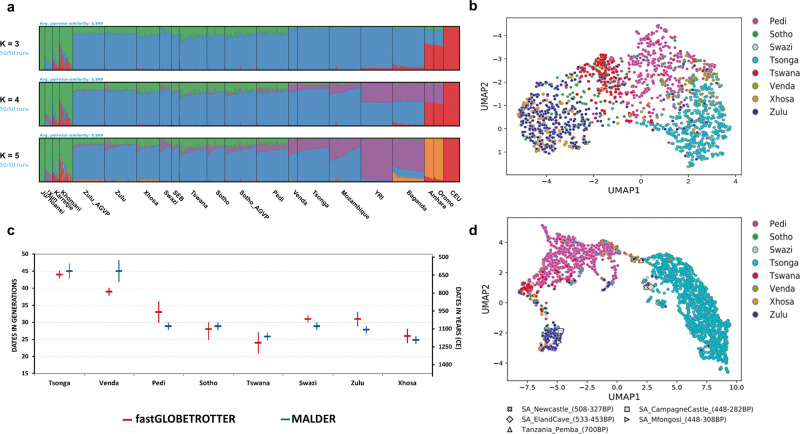
Fig. 2. Gene flow into and genetic continuity of South-Eastern Bantu-speaking (SEB) groups.
a ADMIXTURE plots (from K = 3 to K = 5) based on the merged dataset with downsized ethno-linguistically concordant individuals (Pedi N = 80, Sotho N = 45, Swazi N = 30, Tsonga N = 80, Tswana N = 70, Venda N = 23, Xhosa N = 59, Zulu N = 80, Sotho_AGVP N = 80, Zulu_AGVP N = 80, Mozambique N = 80, SEB N = 19, Amhara N = 24, Oromo N = 24, Baganda N = 80, YRI N = 80, CEU N = 80, Juǀʼhoansi N = 14, Karretjie N = 17,!Xun N = 19 and Khomani N = 34). At K = 3, the plot shows differences in the level of Khoe-San gene flow (shown in green) into different SEB groups, with Tswana and Xhosa showing the highest Khoe-San ancestry proportion and Tsonga and Venda the lowest. Baganda (from Uganda); Amhara, Oromo and Somali (from Ethiopia); Sotho_AGVP and Zulu_AGVP (from South Africa) are from (ref. 32) datasets. The Yoruba (YRI) and Central European (CEU) are from the 1000 Genomes Project dataset61. b Composite representation of the first 10 PCs (generated using ancestry-specific PCA-UMAP) showing population structure in SEB groups persists even after Khoe-San ancestry masking. Sample sizes are same as of Fig. 1c. c Dates for Khoe-San admixture in SEB populations estimated using fastGLOBETROTTER (red dates) and MALDER (blue dates). Figure also showing 95% CI bars (vertical lines) from each method. First y-axis shows admixture dates in generations ago, while the second y-axis shows the actual estimated dates. Confidence intervals (95% CI) of estimates of dates were based on 50 bootstrap replicates for each population in each admixture dating analysis. CE refers to the Common Era. d Composite representation of the first 10 PCs comparing Iron-Age genomes to our SEB groups indicate genetic continuity for the last few centuries in certain regions of South Africa. Sample sizes are same as of Fig. 1c.

