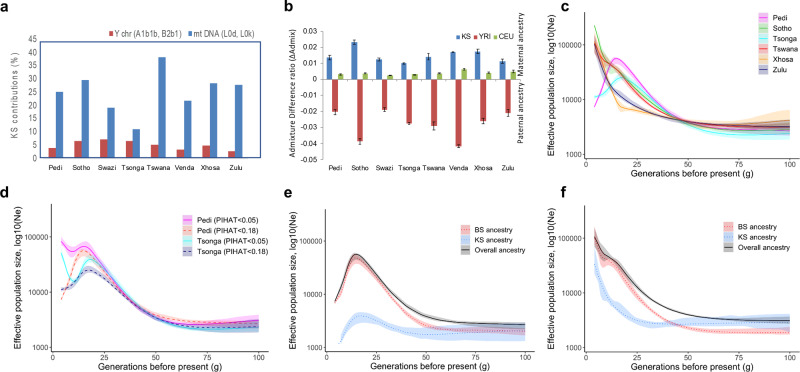
Fig. 3. Insights into the demographic history of South-Eastern Bantu-speaking (SEB) groups.
a Distribution of Khoe-San (KS) associated mitochondrial and Y-chromosome haplogroups in the SEB groups shows higher maternal contribution from Khoe-San. b The analysis of admixture difference ratio (based on X chromosomal and autosomal contributions) confirms this trend and shows the level of bias to vary strongly between the SEB groups. The bars show admixture differences for the three contributing ancestries. Blue shows Khoe-San, red shows Bantu-speaker (represented by KGP Yoruba (YRI)) and green shows Eurasian (represented by KGP Central European (CEU)) ancestries for each SEB group. Positive bar values denote a maternal bias whereas negative values denote paternal bias in contributions from an ancestry. The error bars are based on 50 bootstrapping iterations with 20 samples each (source data provided in Source Data file). c Effective population size (Ne) fluctuations (estimated using IBDNe) shows SEB groups to differentiate mainly in the last 40 generations. d Ne profile differences in Pedi and Tsonga before and after removal of individuals with 0.05<PIHAT < 0.18. e, f Ancestry-specific IBDNe based evaluation of the relative contribution of Khoe-San and BS to the Ne profiles in e Pedi, and f Tswana. For e and f, the black line shows the overall (“true”) Ne while the red and blue lines show the Ne for BS and Khoe-San ancestral components, respectively. The plots show the level of Khoe-San ancestry to correlate with the extent of influence on overall Ne. For c–f, the lines represent maximum likelihood inference, with shaded regions demarcating 95% confidence intervals based on 80 bootstrapping runs.

