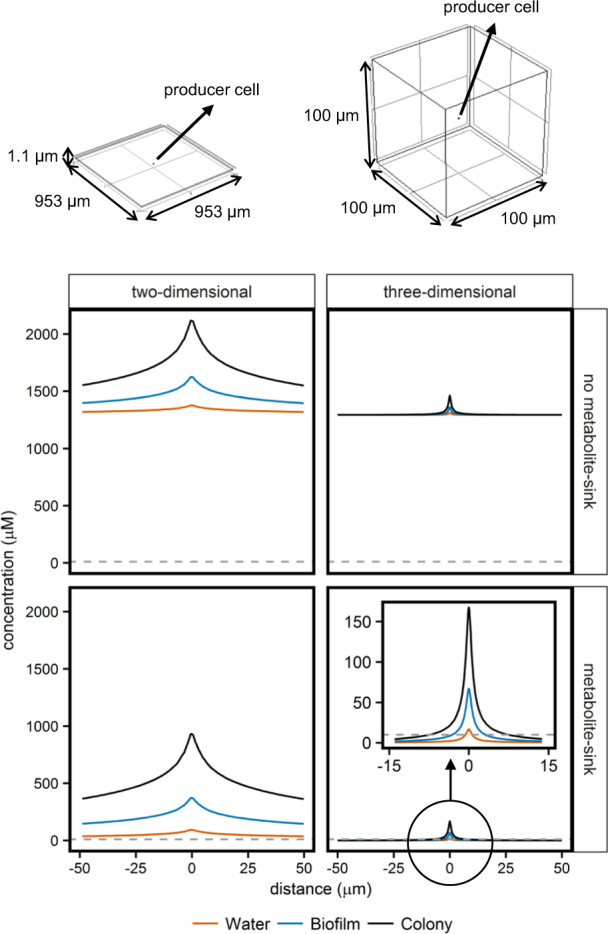
Fig. 1. Predicted concentration gradients in two- and three-dimensional reaction-diffusion systems.

Glucose producing cells were placed in a two- or a three-dimensional space, in the presence and absence of a metabolite-sink. Different environments were simulated by altering the diffusion coefficient. The diffusion coefficient of glucose in water (Ds) was set to 6.7 × 10⁻¹⁰ [30], the diffusion coefficient of glucose in a biofilm (Deff,biofilm,s) was set to 0.25 times Ds [30], and the diffusion coefficient of glucose in a colony (Deff,colony,s) was set to 0.10 times Ds [29, 30] (Table S2). A time-dependent study in COMSOL Multiphysics yielded concentration gradients at several moments. The figure shows the concentration over a horizontal line crossing the producer cell, after 5 h of incubation. To aid visibility the x-axis-range was made similar for both plots, so for the two-dimensional system only part of the concentration gradient profile is shown. The dashed horizontal line indicates a concentration of 10 µM.
