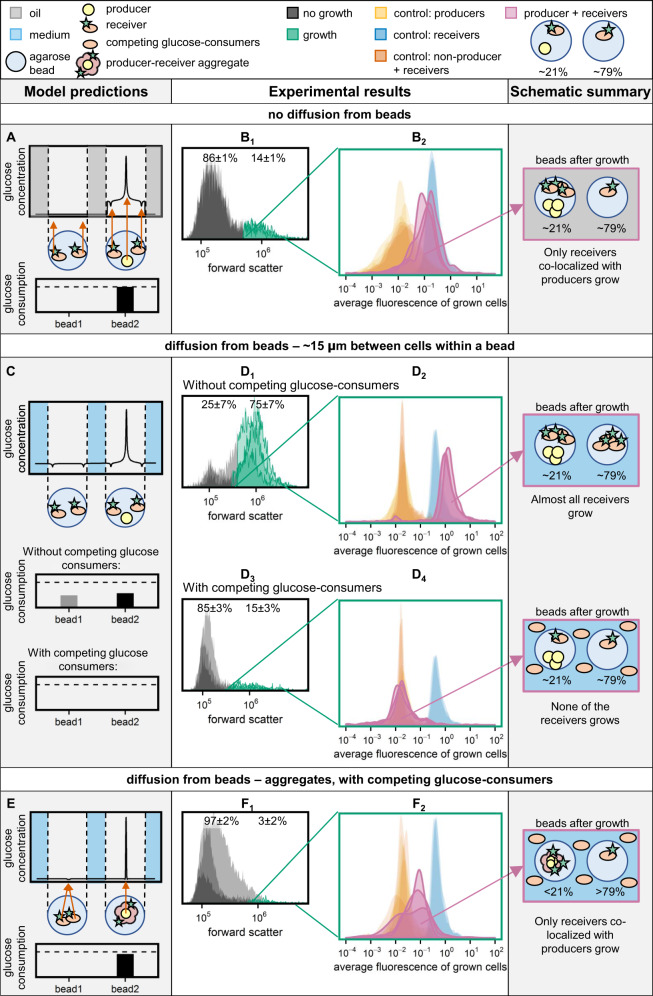
Fig. 3. Consortium response in different spatial structures.
A, C, and E show the predicted concentration gradient at the diagonal of the cube, for the following spatial structure: A no diffusion from beads, C diffusion from beads, 15 µm between cells within a bead, and E diffusion from beads, aggregated cells within a bead. For each condition the glucose uptake (mol/s) after 5 h of incubation was calculated, without considering growth of the cells. Bar plots show the glucose consumption rate (mol/s) in bead 1 (bead without producer cell) and bead 2 (bead with producer cell). Dashed lines indicate the glucose production rate (mol/s) of producer cells, which is equal in all conditions. Produced glucose that is not consumed in bead 1 or bead 2 is consumed by the competing glucose-consumers. In B, D, and F the experimental results are shown for these different spatial structures. Details about the gating strategy are given in Supplementary information section 3, Figs. S4 and S5. Density plots B1, D1, D3, and F1 show the populations that were gated as “growth” in the producer–receiver co-cultures (n = 3, around 3000 agarose beads measured per replicate). Density plots B2, D2, D4, and F2 show the average fluorescence of the grown cells (n = 3). This average fluorescence scales with the receiver cell fraction, as shown by the control samples that are added in the same plot: receivers only, producers only, and co-cultures of non-producers and receivers (n = 3 for each of them). The non-producers and receivers and the producers only controls are overlapping in all plots. The schematic drawing at the right summarizes the results from the presented density plots.

