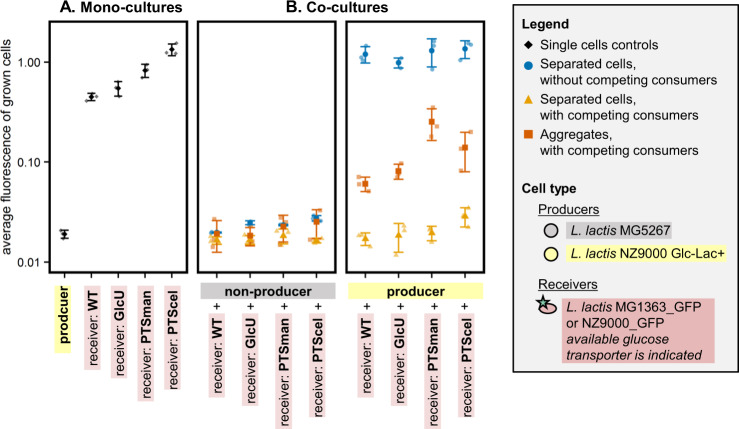
Fig. 4. Effect of glucose transporter affinity and Vmax on the receiver response.
Mono- and co-cultures of (non-)producers and receivers with different glucose transporter types were incubated in agarose beads surrounded by CDM. Receivers are ordered based on their growth rate (Supplementary information section 5, Table S3). L. lactis NZ9000_ PTSman has a Km of 0.013 mM and a Vmax of 0.22 µmol/min/mg protein, L. lactis NZ9000_ PTScel has a Km of 8.7 mM and a Vmax of 0.25 µmol/min/mg protein, and L. lactis NZ9000_ GlcU has a Km of 2.4 mM and a Vmax of 0.08 µmol/min/mg protein [23] (Supplementary information section 4.5). A Producer mono-cultures were incubated in the presence of lactose, receiver mono-cultures in the presence of glucose. In producer mono-cultures agarose beads contained separated cells. B Co-cultures were incubated in the presence of lactose. Agarose beads contained either separated cells (on average 15 µm between cells within a bead), or producer–receiver aggregates (0 µm between cells). The beads were incubated in CDM with and without competing glucose-consumers. For each culture the median and standard error of the average fluorescence of the grown cells is shown (n = 3). Corresponding density plots are shown in Supplementary information section 6, Fig. S12.

