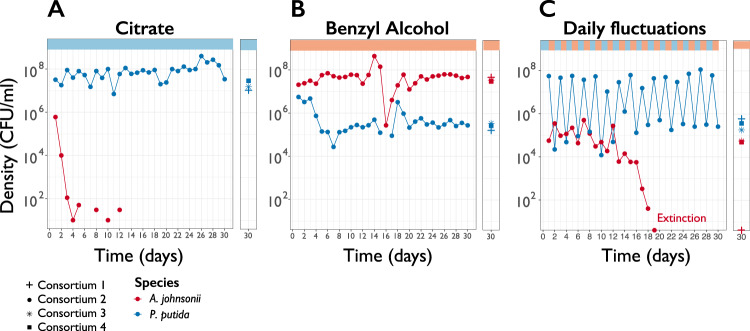
Fig. 1. Two-species consortium displays different eco-evolutionary dynamics in different environments.
Population density (CFU ml−1) trajectories of co-cultures from consortium #2 are shown over 30 days of serial transfers (100-fold dilution) in three environments. Each circle represents the final density of each species after daily cycles of growth; lines connecting circles help visualization and do not have any biological meaning. Densities from the remaining three consortium at day 30 are also plotted (sums, stars and squares symbols). A. johnsonii’s extinction was confirmed by plating consortia for five consecutive days in LB supplemented with streptomycin and confirming zero CFU ml−1.

