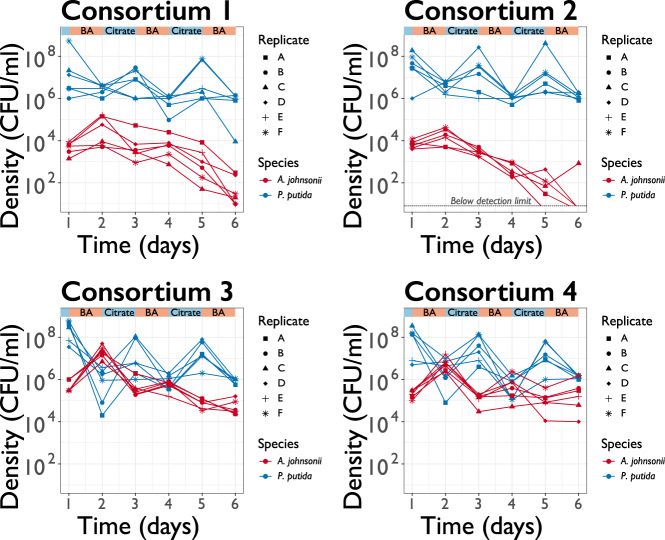
Fig. 2. Coexistence and extinction were reproducible when we replayed the evolution experiment from an intermediate time point.
Population density (CFU ml−1) trajectories of six replicates launched from populations samples frozen at day 14 during the evolution experiment. Each dot represents the final density of each species after daily cycles of growth; lines connecting dots help visualizing replicates dynamics (represented by different symbols) and do not have any biological meaning.

