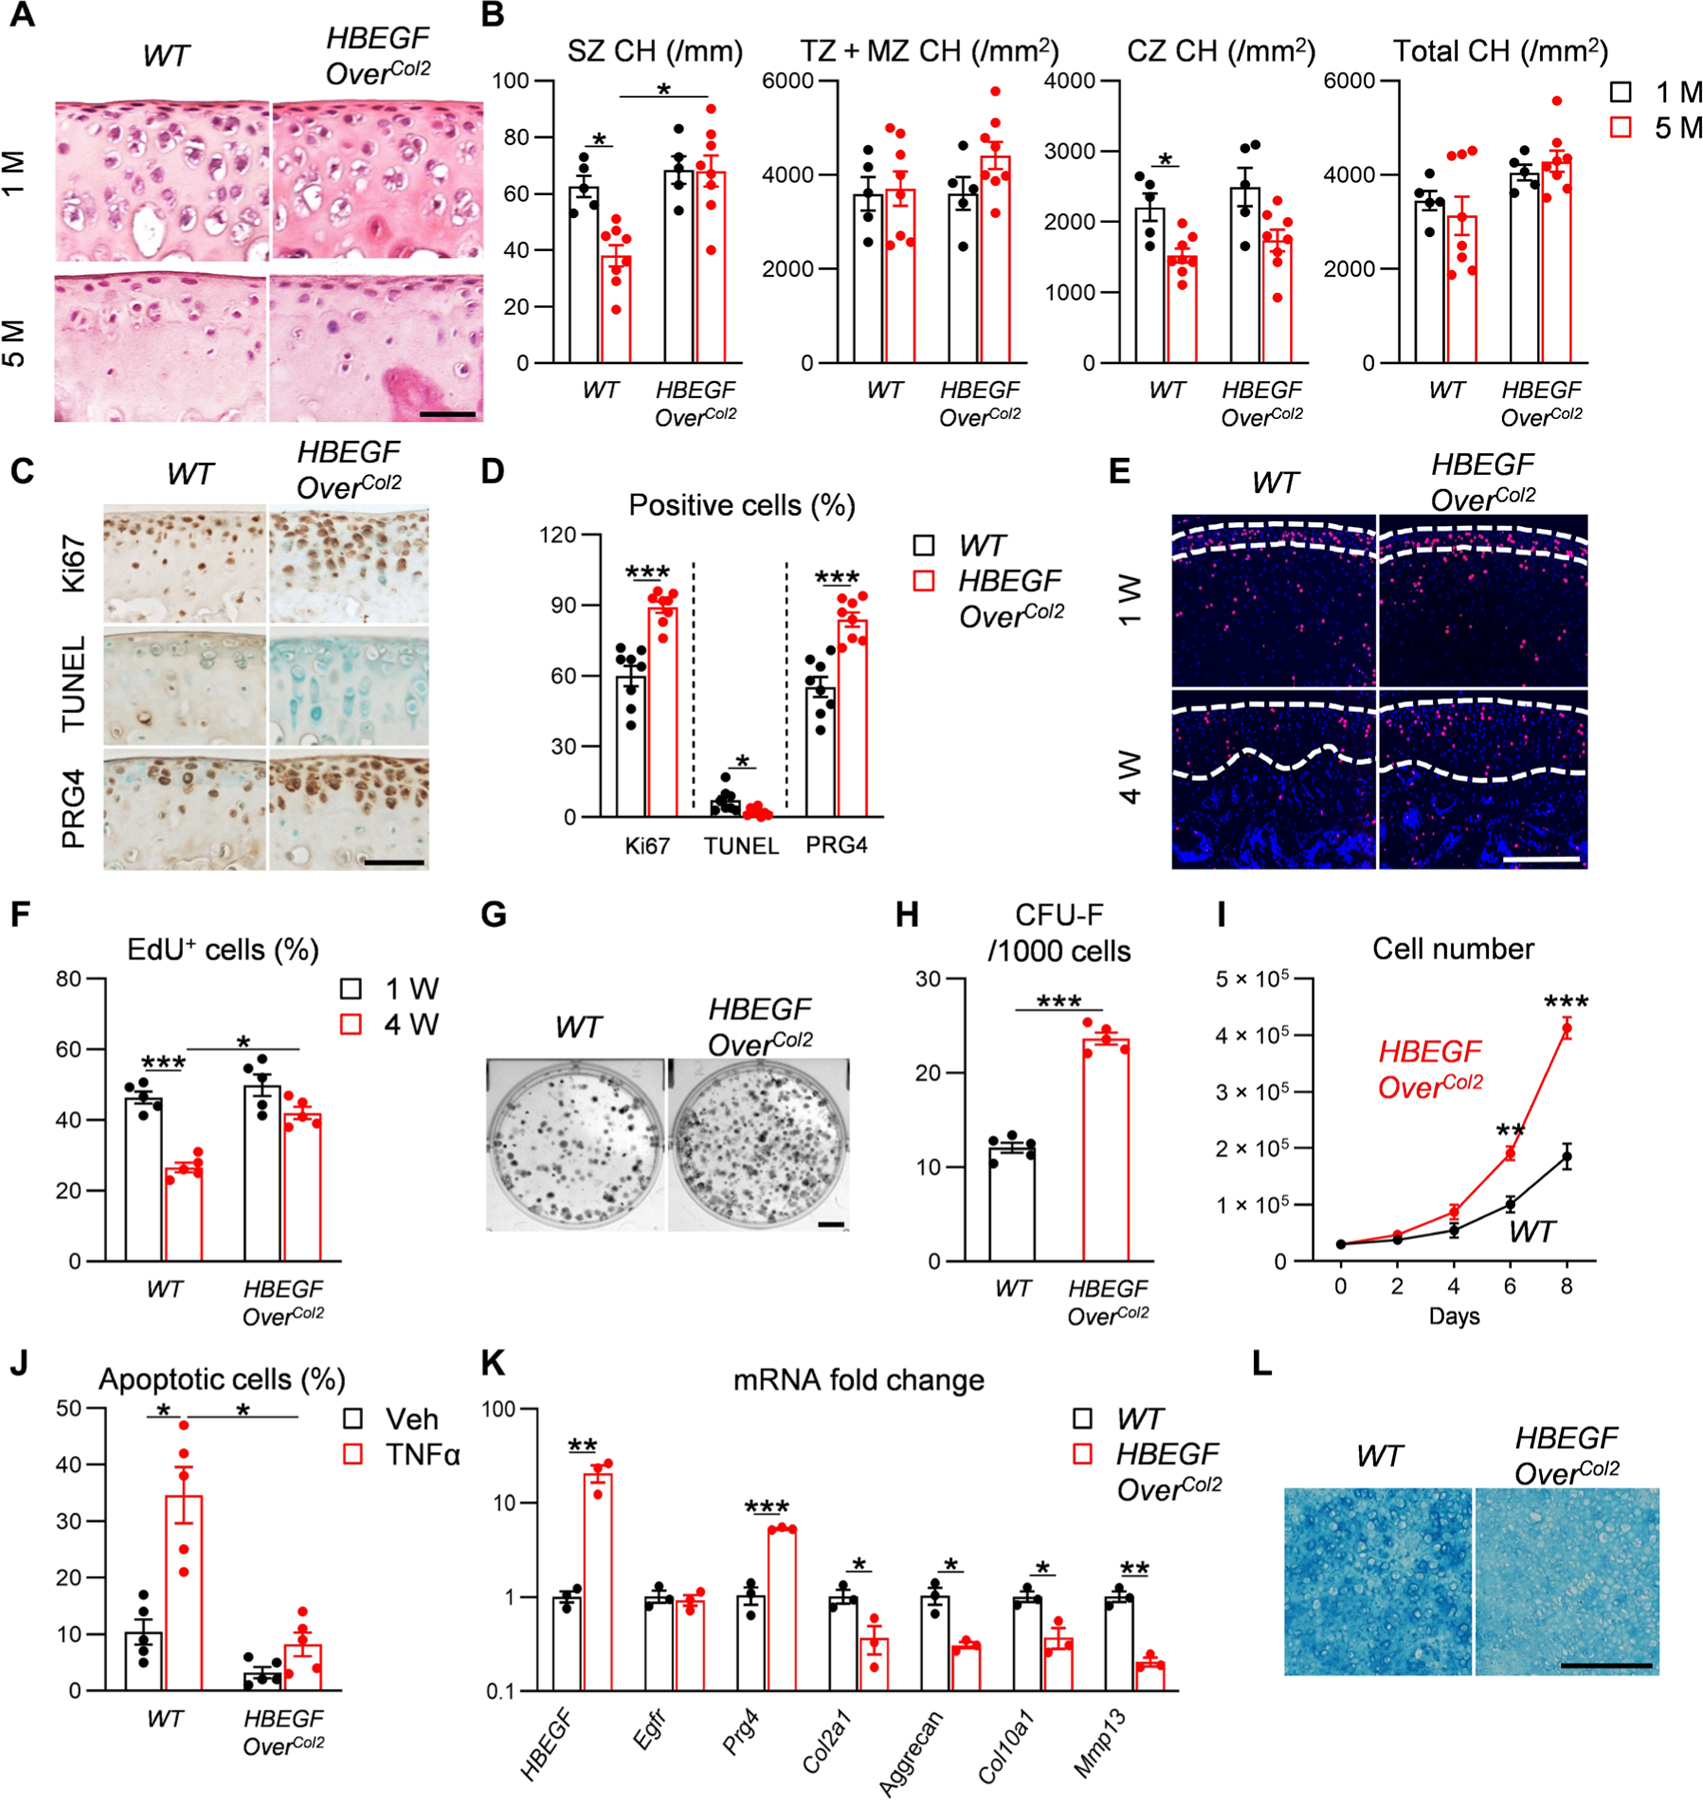
Fig. 2. Overexpression of HBEGF increases chondroprogenitors in articular cartilage.

(A) Hematoxylin and eosin staining of femoral articular cartilage from WT and HBEGF OverCol2 mice at 1 and 5 months of age. Scale bar, 50 μm. (B) Chondrocyte numbers (CH) in superficial zone (SZ), transition and middle zones (TZ + MZ), calcified zone (CZ), and entire femoral articular cartilage quantified at 1 and 5 months of age. n = 8 mice per group. (C) Immunostaining of Ki67, TUNEL, and PRG4 in tibial articular cartilage of 5-month-old WT and HBEGF OverCol2 mice. Scale bar, 50 μm. (D) The percentages of Ki67+, TUNEL+, and Prg4+ cells within articular cartilage were quantified. n = 8 mice per group. (E) Long-term EdU labeling of slow-cycling cells in the tibial articular cartilage of HBEGF OverCol2 mice. Mice received daily EdU injections from postnatal days 4 to 6, and their joints were harvested at 1 and 4 weeks of age for EdU staining. Dashed lines outline periarticular layer (1 week of age) and articular cartilage (4 weeks of age) for analysis. Scale bar, 100 μm. (F) Quantification of EdU+ cells in outlined regions. n = 5 mice per group. (G) CFU-F assay using chondrocytes dissociated from mouse knee joints from 5-month-old WT and HBEGF OverCol2 mice. Scale bar, 0.5 cm. (H) Quantification of CFU-F frequency. n = 5 mice per group. (I) Proliferation of primary chondroprogenitors from 5-month-old WT or HBEGF OverCol2 knee joints. Cells were seeded at the same density on day 0, and their numbers were counted every other day. n = 5 independent experiments. (J) Apoptosis assay of primary chondrocytes from 5-month-old WT and HBEGF OverCol2 knee joints. Cells were incubated with or without TNFα (25 ng/ml) or vehicle (Veh; PBS) for 2 days before analysis. n = 5 independent experiments. (K) qRT-PCR analyzes the relative gene expression in chondroprogenitors from WT and HBEGF OverCol2 knee joints undergoing 2 weeks of chondrogenic differentiation. n = 3 independent experiments. (L) Alcian blue staining of chondroprogenitors after 2 weeks of chondrogenic differentiation. Scale bar, 200 μm. n = 3 independent experiments. Statistical analysis was performed using two-way ANOVA with Tukey’s post hoc analysis for (B), (F), and (J) and unpaired t test for (D), (H), (I), and (K). Data are presented as means ± SEM. *P < 0.05, **P < 0.01, and ***P < 0.001.
