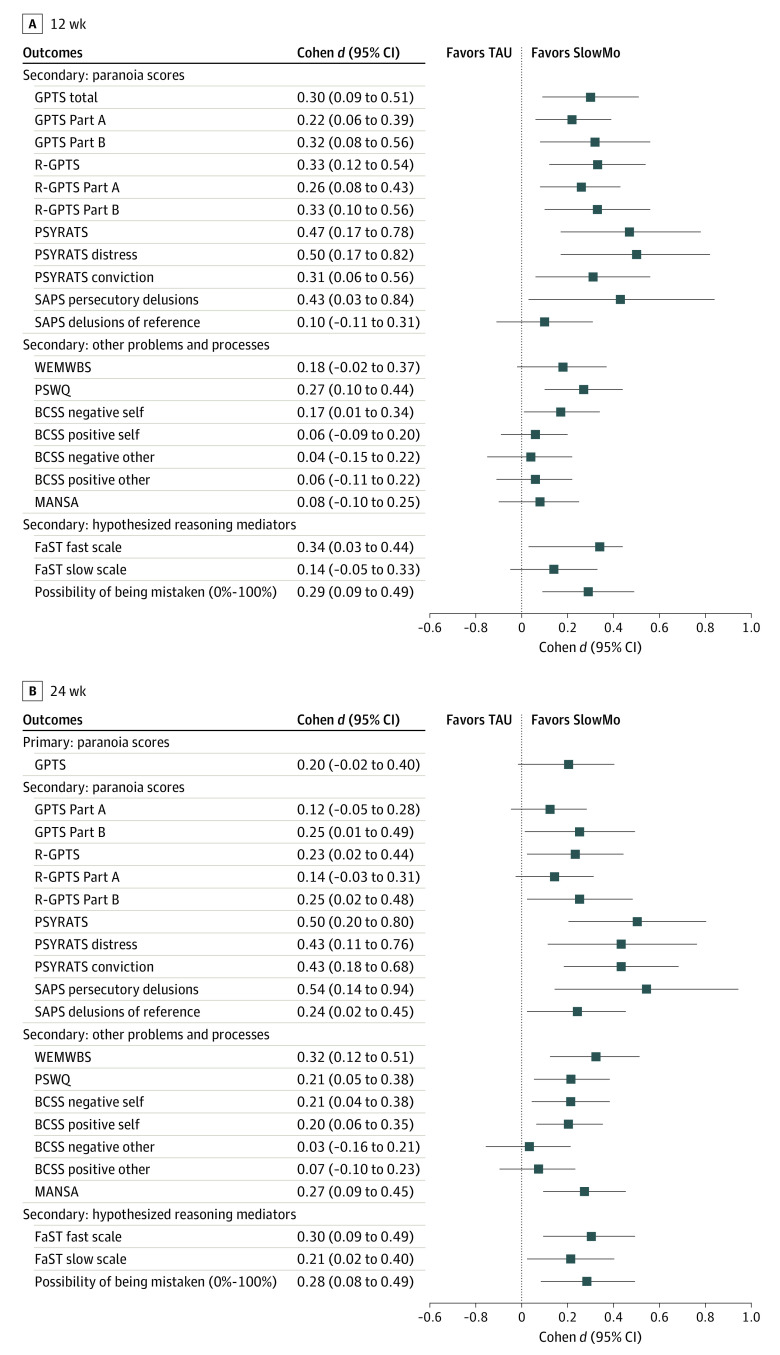
Figure 2. Primary and Secondary Outcomes of SlowMo.
Markers represent point estimates, with horizontal lines representing 95% CIs. BCSS indicates Brief Core Schema Scales; FaST, Fast and Slow Thinking Questionnaire; GPTS, Green et al Paranoid Thoughts Scales; MANSA, Manchester Short Assessment of Quality of Life; PSWQ, Penn State Worry Questionnaire; PSYRATS, Psychotic Symptom Rating Scales; R-GPTS, Revised GPTS; SAPS, Scale for the Assessment of Positive Symptoms; TAU, treatment as usual; and WEMWBS, Warwick-Edinburgh Mental Well-being Scale.

