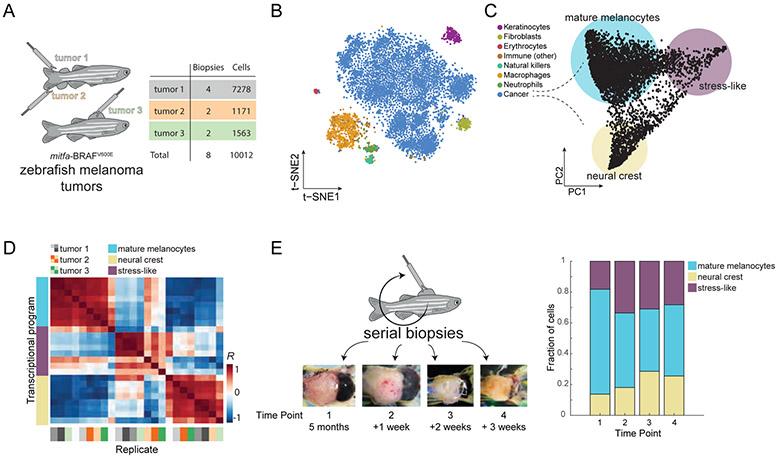
Figure 1. Single-cell RNA-Seq on zebrafish melanoma.
(A) Eight tumor biopsies were processed from three distinct tumors using scRNA-Seq. (B) tSNE analysis of 7,278 individual cells from tumor 1. Color indicates the inferred cell type. (C) PCA on the cancer cells revealed three transcriptional cell states, indicated by the colored circles. (D) Heatmap showing the Pearson’s correlation coefficients between the three cell states across all eight biopsies. Biopsy samples cluster according to states and not tumor or animal of origin. (E) Serial biopsies were taken from the same tumor (tumor 1), at one week intervals. The tumor at each time point is shown in the micrographs. The stacked bar plot indicates the proportions of the transcriptional cell states detected in panel (C) for each biopsy.

