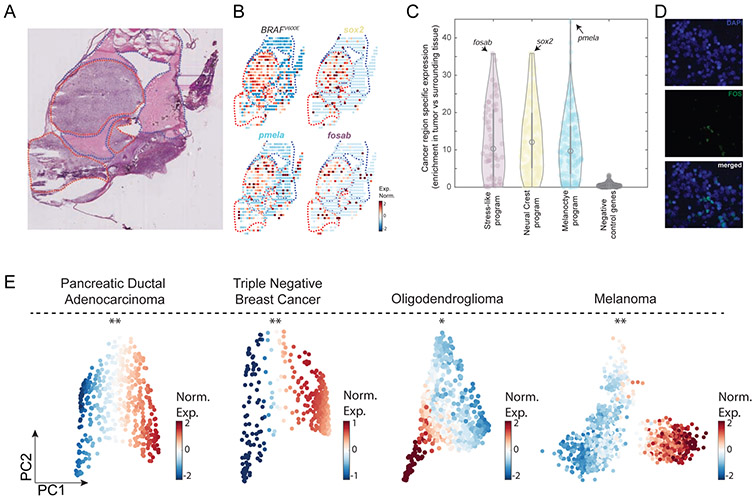
Figure 3. The transcriptional programs of the cancer cell states are enriched in cancer areas and detected at the protein level across cancer types.
(A) Hematoxylin and eosin stain of a zebrafish transplanted tumor section. Red and blue dotted lines mark cancer and non-cancer areas, respectively. (B) Gene expression profiles of the indicated genes obtained by spatial transcriptomics performed on a section adjacent to the one shown in panel A. (C) Violin plots indicating the enrichment of each gene (Man-Whitney test, −log10 of the P-value) in each of the indicated gene programs. Genes shown in panel B are indicated by arrows in each program. Negative control represents a randomly selected set of 200 genes. (D) FOS protein is localized in the cell nuclei (white arrows) as shown by the DAPI nuclear staining (blue, left), FOS immunofluorescence staining (green, middle) and a merged image (right). (E) PCA on PDAC (Moncada et al., 2020), TNBC (Kim et al., 2018), oligodendroglioma (Tirosh et al., 2016b) and melanoma (Tirosh et al., 2016a) tumor cancer cells. Color indicates normalized expression levels of the stress-like program, significantly enriched in one vertex (*, P<10−2; **, P<10−4).

