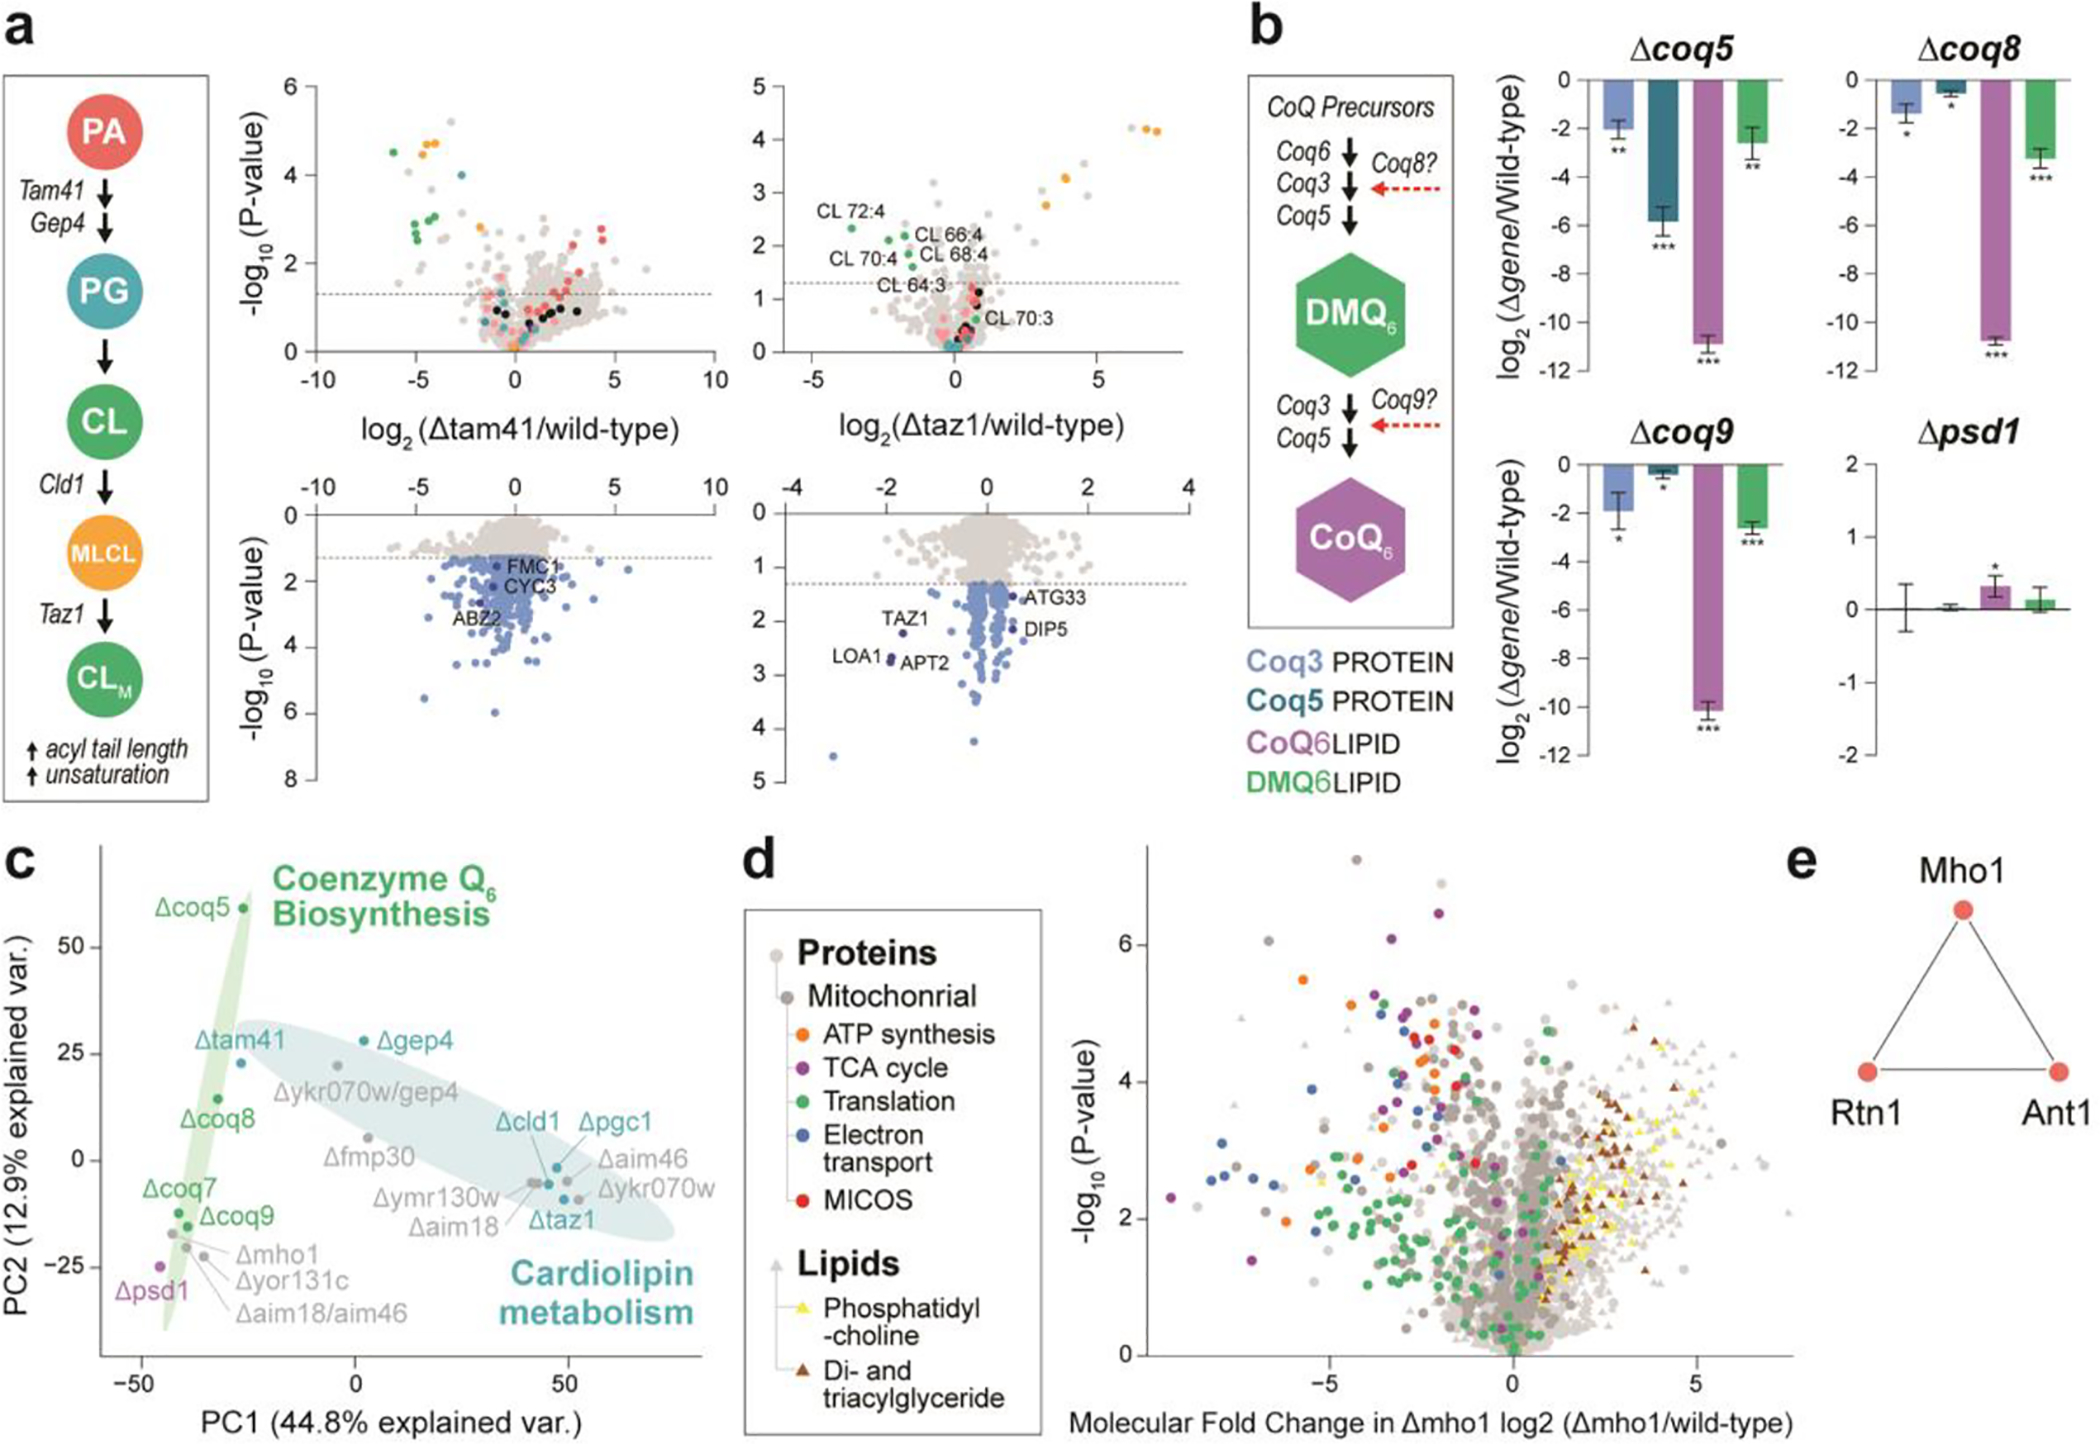
Figure 3. Biological study by MOST.

(a) Schematic pathway of cardiolipin biosynthsis and volcano plots across related gene knockout strains. PA, phosphatidic acid. PG, phosphoglycerol. CL, cardiolipin. MLCL, monolysocardiolipin. (b) Schematic pathway of Co-enzyme Q6 biosynthsis and molecule abundance across related gene knockout strains. *, p-value < 0.05. **, p-value < 0.01. ***, p-value < 0.001. (c) Principal component analysis (PCA) of Δgene strains. (d) Volcano plot showing average fold-change in molecule abundances (mean log2[Δmho1/wild-type]) versus statistical significance, showing select functional groups (GO terms and lipid class) significantly (Benjamini-Hochberg adjusted p-value < 0.05) enriched in either upregulated or downregulated molecules. (e) Nearest neighbor covariance network for Mho1.
