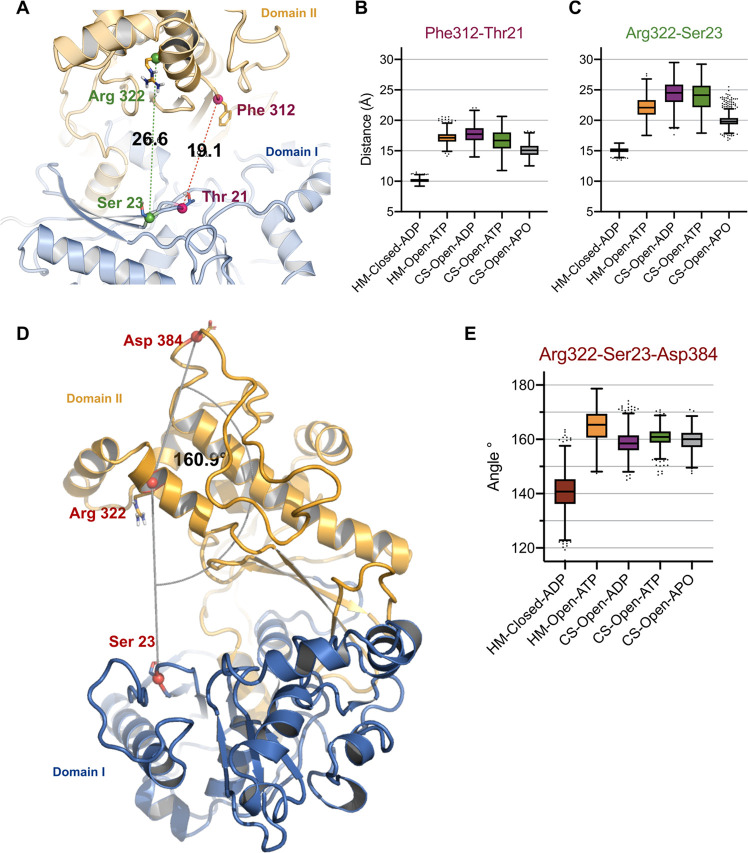
Figure 6.
(A) Illustration of the interdomain residue distances in the crystal structure (CS-Open-ATP). Residue distance measurements calculated throughout the 500 ns trajectory simulation of all systems are presented (B, C). (D) Angle measurement of the interdomain residues in the reference structure (CS-Open-ATP). (E) Angle measurements of the interdomain residues during the 500 ns timescale. Coordinates used for the angle and distance measurements are depicted as spheres. The central box line represents the average, and the points represent Tukey determined outliers.

