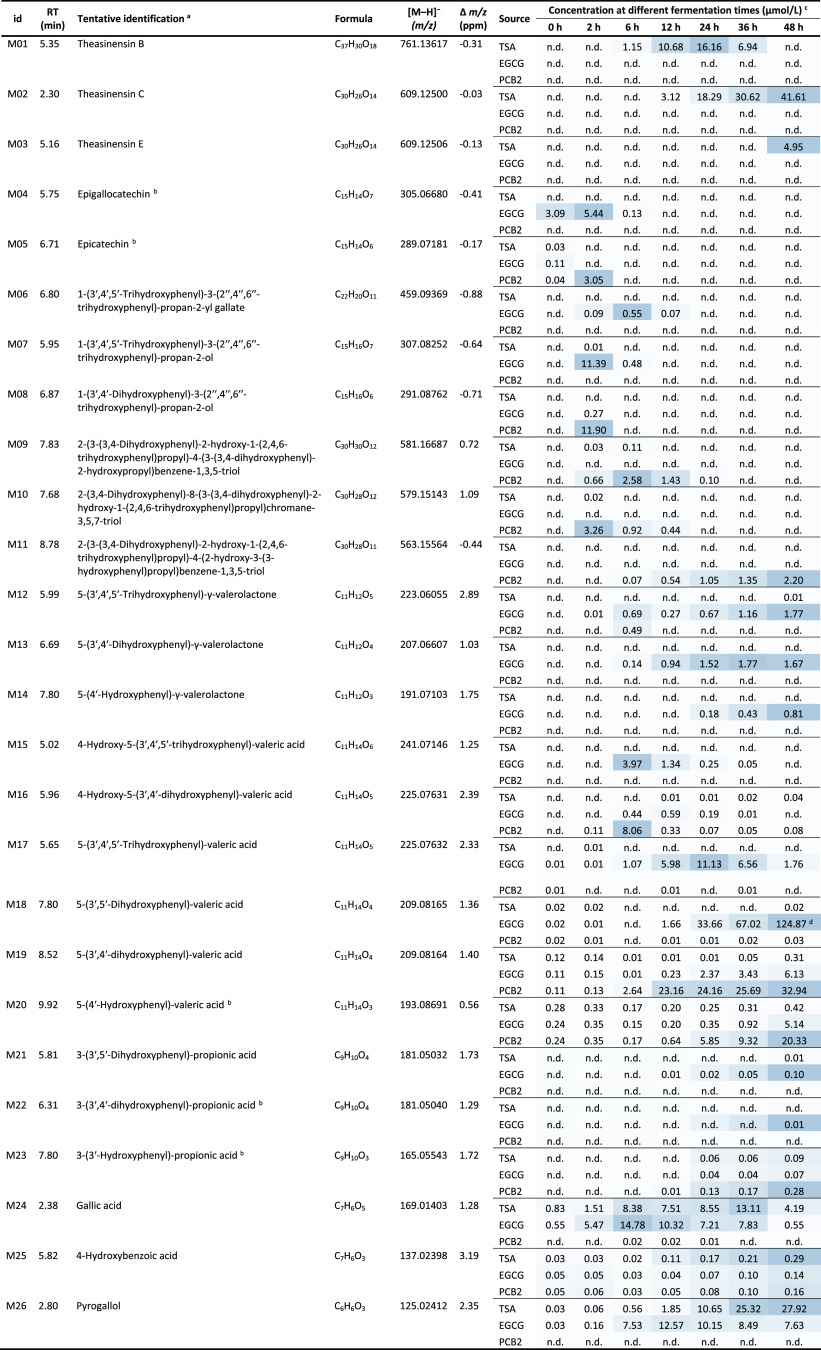
Table 1. Tentative Identifications and Dynamic Changes of Metabolites of TSA, EGCG and PCB2 during Fermentation with HFS.
Supporting mass spectrometric data can be found in Table S2, Supporting Information.
These identifications were confirmed with authentic standards.
Mean value of compound concentrations (n = 3) and n.d., not detected. The colors range from light blue to dark blue indicating the range from low to high relative concentration for each metabolite detected in all samples.
The quantification of this compound was calculated based on 5-(4′-hydroxyphenyl)valeric acid, which may have different response factors, and thus resulted in overestimation in the concentration.

