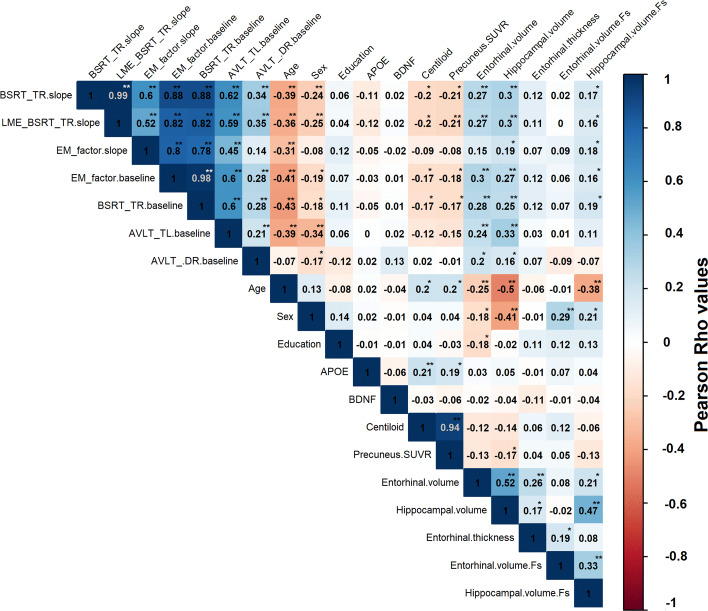
Fig. 3.
Correlation matrix for episodic memory decline. Correlation matrix assessing the relation between cognitive decline on the BSRT TR score, weighted composite episodic memory factor and other variables. The colour scale depicts the strength of the Pearson correlation coefficient (Rho). A more positive value for the cognitive slope corresponds to less decline. Superimposed text reflects the actual numerical value of the Pearson correlation coefficient. The last three cells are FreeSurfer-based imaging measures: cortical thickness as specified, as well as ICV adjusted grey matter volumes (.Fs). The asterisk depicts the significance of the correlation: **P value <0.001, *P value <0.05. APOE, Apolipoprotein E; AVLT, Rey Auditory Verbal Learning Test; TL, total learning; DR, long-term percentage delayed recall; BDNF, Brain-Derived Neurotrophic Factor; BSRT TR, Buschke Selective Reminding Test total retention; EM, episodic memory; LME, linear mixed-effects; SUVR, standardized uptake value ratio image

