Figure 2.

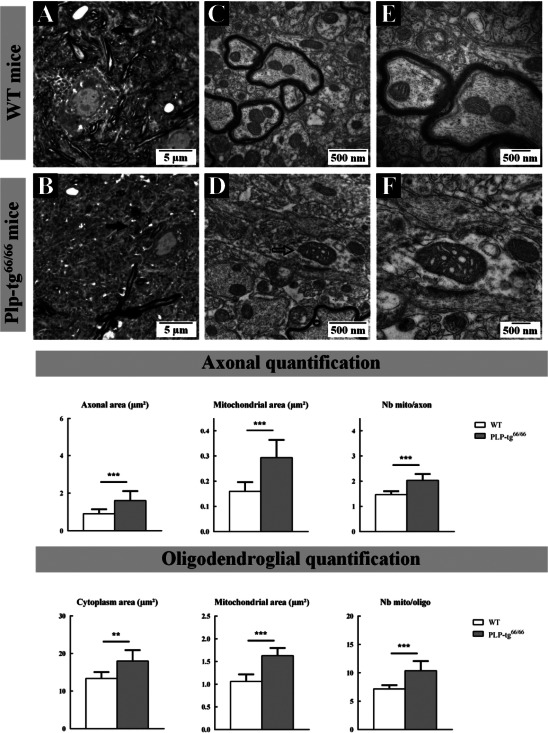
Neuropathological analysis of the gray matter cervical spinal cord of 6‐week‐old wild‐type and Plp1 overexpressing (PLP‐tg66/66) mice. Seven hundred‐nanometre semithin epoxy embedded cervical spinal cord sections from WT (A) and PLP‐tg66/66 (B) mice stained with toluidine blue. Photographs taken at 100× length of gray matter intermediate zone (A, B). Seventy‐nanometre ultrathin sections stained with uranyl acetate and lead citrate from WT (C, E) and PLP‐tg66/66 (D, F) obtained from the same block than semithin sections. Electron micrographs of sections from WT (C) and PLP‐tg66/66 (D) magnification ×25 000 and from WT (E) and PLP‐tg66/66 (F) magnification ×50 000. Numerous bundles of small axons well oriented in the rostrocaudal direction and markedly myelinated were observed in WT mice; these axons were unmyelinated in PLP‐tg66/66 mice (Black filled arrows; A and B). The electron microscopy analysis also revealed a dramatic increase in size of some mitochondria in the gray matter of PLP‐tg66/66 mice, many exhibiting also abnormal cristae morphology (Black empty arrows; D). Quantifications made in 3 WT and 3 PLP‐tg66/66 confirmed the increase in size of both axon and oligodendrocyte cytoplasm in PLP‐tg66/66 as well as the increase in mitochondria size and number. Statistical analysis was performed by two‐way ANOVA; *P < 0.05, **P < 0.01; ***P < 0.001.
