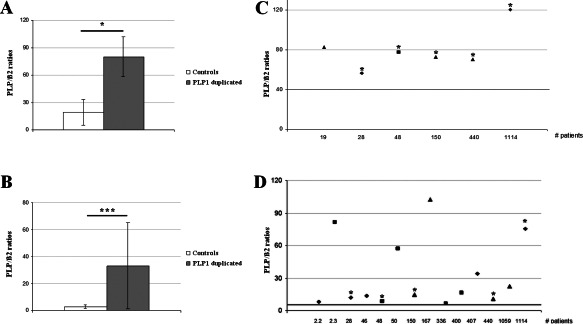
Figure 7.

PLP‐DM20 mRNA quantification in nerves and skin fibroblasts from PMD patients with a PLP1 duplication. Histograms represent the mean ratio obtained for control and PLP1 duplicated patient nerves (A) and fibroblasts (B). Graphs represent individual data obtained for each PLP1 duplicated patient nerves (B) and fibroblasts (D) as well as a pathological threshold value (bold line) determined by a ROC curve using ratios from patients and from controls. Severity of the disease is mentioned as: form 1 by triangle, form 2 by a square and form 3 by a rhomb. *mentioned the patients with results obtained in both the fibroblasts and the peripheral nerve (C, D). Statistical analysis was done by non‐parametric Wilcoxon test (A, B); *P < 0.05, **P < 0.01; ***P < 0.001.
