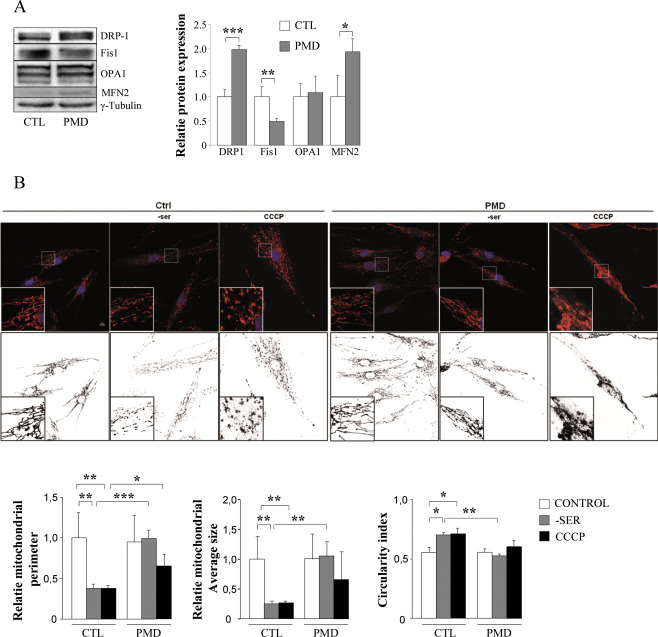
Figure 9.

Disturbed mitochondrial dynamics in human PMD fibroblasts on fission stimuli. Relative protein expression of DRP1, Fis1, OPA1 and MFN2 in human Control and PLP1‐duplicated PMD fibroblasts (A). Confocal microscopy of stained Control and PMD fibroblasts with anti‐Tom20 antibody and DAPI (nuclei) following exposure to serum depletion for 8 h or CCCP (200 μM) for 1 h (B). Lower panels show enlarged areas of the white boxes in the above panels. Scale bar: 10 uM. Digital images were subjected to a convolve filter through the National Institutes of Health‐developed IMAGEJ software to isolate and equalize fluorescent pixels in the image. After thresholding, individual particles (mitochondria) were analyzed for diameter, average size and circularity. Lower panels show Software processed images (Black and white). A total of 20 cells (n = 3 Ctrl and n = 3 PMD) were examined for each condition. Statistical analysis was performed by one‐way ANOVA and Tukey's HSD post hoc; *P < 0.05, **P < 0.01.
