

Abstract
We investigated the challenging diagnostic case of a ventricular cystic glioneuronal tumor with papillary features, by RNA sequencing using the Illumina TruSight RNA Fusion panel. We did not retrieve the SLC44A1‐PRKCA fusion gene specific for papillary glioneuronal tumor, but an EWSR1‐PATZ1 fusion transcript. RT‐PCR followed by Sanger sequencing confirmed the EWSR1‐PATZ1 fusion. It matched with canonic EWSR1 fusion oncogene, juxtaposing the entire N‐terminal transcriptional activation domain of EWSR1 gene and the C‐terminal DNA binding domain of a transcription factor gene, PATZ1. PATZ1 protein belongs to the BTB‐ZF (broad‐complex, tramtrack and bric‐à‐brac ‐zinc finger) family. It directly regulates Pou5f1 and Nanog and is essential to maintaining stemness by inhibiting neural differentiation. EWSR1‐PATZ1 fusion is a rare event in tumors: it was only reported in six round cell sarcomas and in three gliomas of three exclusively molecular studies. The first reported glioma was a BRAFV600E negative ganglioglioma, the second a BRAFV600E negative glioneuronal tumor, not otherwise specified and the third, very recently reported, a high grade glioma, not otherwise specified. In our study, forty BRAFV600E negative gangliogliomas were screened by FISH using EWSR1 break‐apart probes. We performed methylation profiling for the index case and for seven out of the ten FISH positive cases. The index case clustered apart from other pediatric low grade glioneuronal entities, and specifically from the well‐defined ganglioglioma methylation group. An additional pediatric intraventricular ganglioglioma clustered slightly more closely with ganglioglioma, but showed differences from the main ganglioglioma group and similarities with the index case. Both cases harbored copy number variations at the PATZ1 locus. EWSR1‐PATZ1 gene fusion might define a new type of glioneuronal tumors, distinct from gangliogliomas.
Keywords: DNA methylation profiling, EWSR1, ganglioglioma, glioneuronal tumors, PATZ1
Introduction
The histological diagnosis of glioneuronal tumors of the central nervous system (CNS) can be very challenging. For example, neuronal differentiation and papillary features are shared by papillary glioneuronal tumors (PGNT), rosette forming glioneuronal tumors, angiocentric gliomas and some gangliogliomas 2, 13, 15, 16. Many useful molecular signatures have been discovered over the last 10 years. They can confirm the diagnosis of some tumor entities or give strong indications for a certain diagnosis for others. For example, the SLC44A1 (solute carrier family 44, member 1)‐PRKCA (protein kinase C alpha) fusion gene has been shown to be associated with PGNT 2 and almost pathognomonic of this diagnosis 16, 18. The BRAFV600E mutation is a useful diagnostic marker in ganglioglioma 7, even if some of its differential diagnoses such as dysembryoplastic neuroepithelial tumor (DNET) can exhibit this mutation 4, 23. This BRAFV600E mutation is found in about half of gangliogliomas 4, 7. Recent studies of large cohorts of glioneuronal tumors using massive parallel sequencing/next generation sequencing (NGS) underlined the power of molecular alterations to ascertain the diagnosis of these rare tumors 19, 21. Moreover, NGS allows uncovering of new molecular alterations, RNA‐sequencing being a powerful tool to detect novel gene fusions. In our index case (Case 1), a challenging diagnostic case of an intraventricular glioneuronal tumor with papillary features, we used targeted RNA sequencing to identify a diagnostic molecular signature. Neither the BRAFV600E mutation nor the SLC44A1‐PRKCA fusion was present but an EWSR1 (Ewing Sarcoma Breakpoint Region 1)‐PATZ1 (POZ/BTB And AT Hook Containing Zinc Finger 1) gene fusion was detected. This alteration was reported only in rare round cell sarcomas 14, 29 and very recently in three CNS tumors. Each of these three tumors with EWSR1‐PATZ1 fusion was retrieved as a unique case in the screening of large series of glial or glioneuronal tumors 1, 10, 21. The first reported case was a BRAFV600E negative ganglioglioma, the second a BRAFV600E negative glioneuronal tumor, not otherwise specified and the third, very recently reported, a high grade glioma, not otherwise specified. These studies were purely molecular and no histological or clinical details were reported. The authors did not address the issue whether EWSR1‐PATZ1 fusion could define a new tumor entity. We screened forty BRAFV600E negative gangliogliomas by FISH using EWSR1 break‐apart probes. A 10% cut‐off value was used to minimize false negative as the interval between EWSR1 and PATZ1 loci is only 20 Mb. We performed methylation profiling for the index case and for seven out of the ten FISH positive cases. This method is accurate and robust for classification into tumor subgroups and is applicable to standard pathology specimens. It has recently been applied for reliable subgrouping of large series of CNS tumors 9, 25. Case 1 was characterized by a DNA methylation profile clearly distinct from other pediatric low‐grade tumors, and specifically from the well‐defined ganglioglioma methylation group. An intraventricular BRAFV600E ganglioglioma (Case 2) clustered slightly more closely with ganglioglioma, but showed similarities with the index case. This genome wide DNA methylation assay also generates genome‐wide copy‐number profiles. Both cases had copy number variations around the PATZ1 locus at 22q12.2. We propose that PATZ1 fusion might define a new glioneuronal tumor entity. This fusion may be an oncogenic driver alteration for glioneuronal tumors, as has been recently suggested for EWSR1‐PATZ1 sarcomas 29.
Materials and Methods
Patients
The index case (Case 1) was histopathologically diagnosed as a papillary glioneuronal tumor (PGNT) (EUC, AS) and RNA sequencing was applied to search for the SLC44A1‐PRKCA fusion gene specific for this diagnosis 3.
Paraffin‐embedded samples obtained from 40 patients with a diagnosis of BRAFV00E negative gangliogliomas were retrieved from the archives of pathology departments in five french university hospitals. They were histopathologically considered to be consistent with gangliogliomas after central pathologic review (EUC, AS).
RNA extraction
RNA was isolated from FFPE (Formalin fixed paraffin embedded) material using approximately 5 sections of 10 microns. The High Pure FFPE RNA Isolation Kit (Roche, Boulogne‐Billancourt, France) was used according to the standard protocol. RNA was quantified by fluorimetric assay (Qubit Fluorometric Quantitation, Thermo Fisher Scientific, USA). The percentage of RNA fragments > 200 nt (fragment distribution value; DV200) was evaluated by capillary electrophoresis (Agilent 2100 Bioanalyzer). A DV200 > 30% was required to process the next steps of analysis.
RNA sequencing
NGS‐based RNA sequencing was performed using the Illumina TruSight RNA Fusion Panel on a MiSeq instrument according to the manufacturer's instructions (Illumina, San Diego, CA, USA). This targeted RNA sequencing panel covers 507 fusion‐associated genes, to assess most known cancer‐related fusions. The TruSight RNA fusion panel gene list is available at https://www.illumina.com/content/dam/illumina-marketing/documents/products/gene_lists/gene_list_trusight_rna_fusion_panel.xlsx. 7690 exonic regions are targeted with 21 283 probes. Libraries were prepared according to Illumina's instructions of TruSight RNA fusion Panel kit. Over 99% of the 3 829 861 reads of the Case 1 sample were aligned. Percentages of 61.45 of the reads were duplicate/replicate.
Bioinformatic analysis of NGS data
Processed data were obtained by using the BaseSpace® RNA‐Seq Alignment v1.0 App (Illumina, San Diego, CA, USA). This application runs STAR v2.5.0b to produce aligned reads in relation to the Homo sapiens reference genome (UCSC hg19) 6. The Manta tool was used for fusion calling 5.
RT‐PCR and sequencing for EWSR1‐PATZ1
Total RNA was retrotranscribed to cDNA using SuperScript® II First‐Strand Synthesis System (Invitrogen, Carlsbad, USA) and random primers according to manufacturer's instructions. PCR reactions were performed using Taq DNA polymerase (Invitrogen, Carlsbad, USA). The primers pairs used to amplify and sequence the fusion transcripts of interest were: EWSR1_Fw 5′‐GGGGGATTTGATCGTGGAGGC‐3′ PATZ1_Rev 5′‐GTCGGGGTCTTCAGAGATGG‐3′; EWSR1_Fw 5′‐TTGATCGTGGAGGCATGAGC‐3′ PATZ1_Rev 5′‐ TCGGGGTCTTCAGAGATGGG‐3′. After quality check on tapeStation (Agilent, Santa Clara, USA), amplicons were purified by Agencourt® AMPure® XP (Beckman Coulter, Brea, USA) according to manufacturer's instructions. These amplicons were sequenced using the Sanger method using GeXP Genetic Analysis System (Beckman Coulter, Brea, USA).
EWSR1 FISH
FISH analysis was performed in forty BRAFV600E negative gangliogliomas. Five‐µm‐thick sections of the formalin‐fixed, paraffin‐embedded tissues on silanized slides were deparaffinized for 3 × 10 min in xylene, washed in 100% ethanol, air‐dried, incubated in 2 × SSC (sodium saline citrate) at 72°C for 40 minutes, incubated in a proteinase K solution (500 µg/mL in 2 × SSC, Roche, Meylan, France) at 45°C for 5 to 80 minutes, washed in 2 × SSC for 2 × 3 minutes at room temperature and stored in 70% ethanol at 4°C. FISH using the SureFISH EWSR1 probe (Agilent, Santa Clara, USA) was performed on a full tissue section. The probe cocktail decorates the human chromosomal EWSR1 gene 5′ with a green signal (EWSR1 5′ BA 564 kb Green, Human Chr22: 29100656–29664246), and the EWSR1 gene 3′ with a red signal (EWSR1 3′ BA 263 kb, red, Human Chr22: 29695821–29958416). All FISH was performed according to the manufacturer's protocol. Minimums of 100 nuclei per slide were visualized. Positive score was interpreted when at least 10% of the nuclei showed a break‐apart signal. For each series of experiments, a control slide from a Ewing sarcoma case known to harbour EWSR1 rearrangement was examined. Pictures were captured using a Panoramic 250 Flash II (3DHistech, Budapest, Hungary) and analyzed using “Case viewer” software (3DHistech, Budapest, Hungary).
DNA methylation and copy number analysis
DNA for the confirmed/suspected PATZ1‐fused cases was extracted from tumors and analyzed for genome‐wide DNA methylation patterns using Illumina HumanMethylationEPIC BeadChip arrays. Handling was carried out according to manufacturer's instructions, at the Genomics and Proteomics Core Facility of the German Cancer Research Center (DKFZ). Processing of DNA methylation data was performed with custom approaches as previously described 9, 25, unsupervised hierarchical clustering was performed using the 10 000 most variably methylated probes across the cohort for the two test cases and selected reference cases from the Heidelberg Molecular Neuropathology platform (https://www.molecularneuropathology.org/mnp) for ganglioglioma, dysembryoplastic neuroepithelial tumor and cortical pilocytic astrocytoma. Clustering was according to Euclidean distance measures and complete linkage.
Copy number profiles were generated using the “conumee” package for R (https://www.bioconductor.org/packages/release/bioc/html/conumee.html).
Results
Case histories
Case 1
A 32‐year‐old‐woman consulted for neck pain of three‐week duration without any headaches, nausea or vomiting. She also complained about visual disturbance corresponding to a vertical diplopia fluctuating over time. MRI showed a tumor in the left lateral ventricle with a moderate ventricular dilatation suggesting central neurocytoma (Figure 1). Total surgical resection was achieved. Considering the low grade histological appearance of the tumor, this patient did not receive additional treatment after resection. One year after surgery, the patient was symptom free and MRI showed no sign of recurrence of the tumor.
Figure 1.
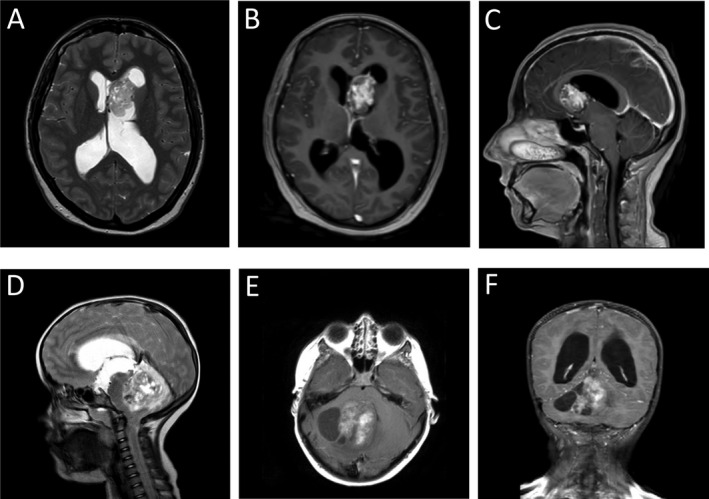
Pre‐operative MR images for Cases 1 and 2. Case 1 MRI showed a tumor in the left lateral ventricule with a moderate ventricular dilatation suggesting central neurocytoma. Low heterogenous signal in T2 (A). T1‐weighted images with marked gadolinium enhancement of the tumor (B, C). Case 2 MRI revealed a cystic lesion in the right cerebellar hemisphere extending into the 4th ventricule and the tentorial incisure. T2 heterogeneous signal (D). Spontaneous T1 signal hyperintensity may correspond to hemorrhage (E). T1‐weighted images with marked and heterogeneous gadolinium enhancement of the tumor. Dilatation of the ventricular system was observed (F).
Case 2
A 7‐year‐old‐girl was seen in an emergency department for hydrocephalus symptoms with cerebellar ataxia and right lower limb pain. MRI revealed a cystic tumor in the right cerebellar hemisphere extending into the 4th ventricle and the tentorial incisure (Figure 1). Dilatation of the ventricular system was observed. CT‐scan showed calcifications. An urgent ventriculocisternostomy was performed by endoscopy. Retrospectively, she had light balance disorders with falls of one year duration. During the last months, headaches with projectile morning vomiting occurred monthly. Worsening of symptoms occurred over the last couple of months. At a later timepoint, surgical resection of the tumor was carried out. A small tumor remnant was shown by postoperative MRI. Considering the low grade histological appearance of the tumor, this patient did not receive additional treatment after resection. MR scans at 3 months follow up showed a stable tumor remnant. Clinically, the patient is doing well with a right light ataxia.
Histology
Case 1
A striking aspect of this tumor cell proliferation was a rich vascular network (Figure 2A) with marked hyalinization (Figure 2C and Supporting Information Figure S1G). Relatively poorly differentiated cells with oval hyperchromatic nuclei and poorly delimited eosinophilic cytoplasm surrounded hyalinized vessels (Figure 2B). These tumoral cells were immunopositive for olig2 and synaptophysin (Figure 2D,E). In other areas, tumor cells with irregular or pleomorphic nuclei and clear cytoplasm formed lobules delimited by a dense reticulin network in which fusiform astrocyte‐like cells were seen (Figure 2G,H and Supporting Information Figure S1A,B). These fusiform cells were immunonegative for GFAP and PS100, whereas pleomorphic clear cells within lobules showed immunoreactivity for both antibodies (Figure 2I and Supporting Information Figure S1C,D). Outside the dense reticulin‐rich lobular areas, pleomorphic clear cells with some large nuclei were also observed forming patternless sheets [Supporting Information Figure S1A (left side),E,F]. Neurofilament proteins immunoreactivity was limited to rare axons and few included ganglionic neurons more likely entrapped than intrinsic to the lesion (Figure 2F). The surgical sample was composed exclusively of tumor tissue. Margins were not seen, but the lack of reactivity for neurofilament proteins in solid sheets within the tumor, suggested a circumscribed tumor. Few calcifications were present. Mitotic activity was very low with a Ki67 labelling index under 3% contrasting with some marked atypia (Supporting Information Figure S1B,E,F,H). No staining was observed with IDH1R132H, BRAFV600E and chromogranin antibodies. No CD34 staining was observed outside the vessels. The architectural pattern of this benign glioneuronal tumor and the ventricular localization, lead us to suggest a diagnosis of papillary glioneuronal tumor, despite the heterogeneous staining with GFAP. The dense reticulin network and the presence of ganglionic cells could also fit with ganglioglioma.
Figure 2.
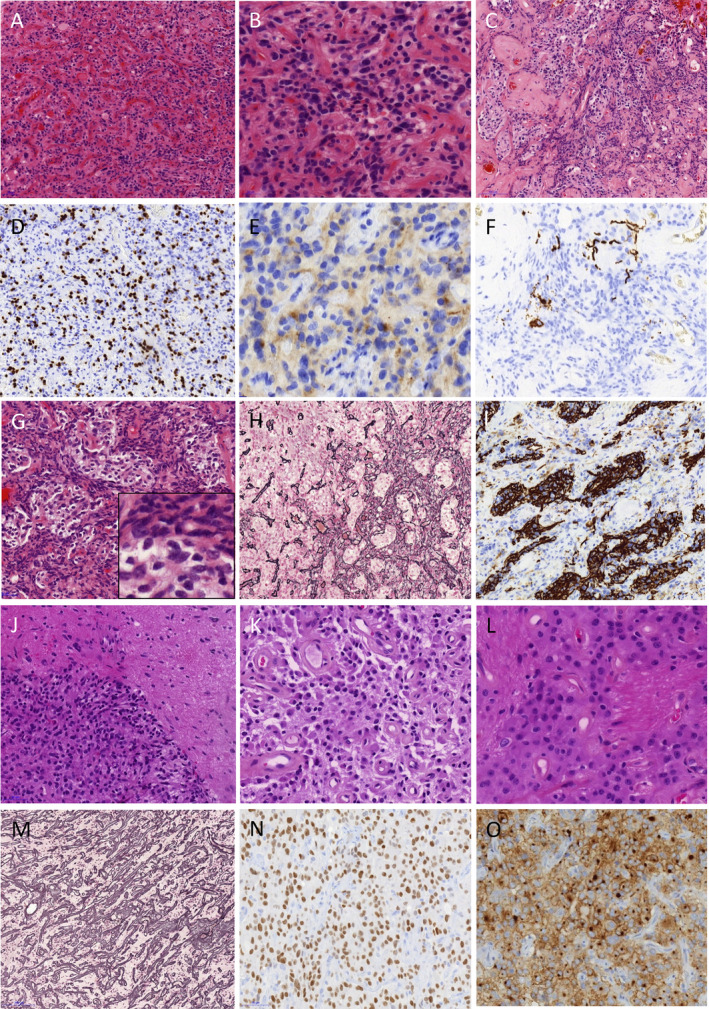
Representative histopathology of the Cases 1 and 2. Case 1: Hematoxylin and eosin–stained sections exhibit tumor cell proliferation with a rich vascular network (A) surrounded by poorly arranged cells without clear astrocyte or neuronal differentiation (B). A marked hyalinization is often observed (C). Tumoral cells were immunopositive for olig2 (D) and synaptophysin (E). Neurofilament proteins immunoreactivity is limited to rare axons and few included ganglionic neurons (F). Tumoral cells with irregular or pleomorphic nuclei and clear cytoplasm form lobules surrounded by fusiform astrocyte‐like cells, (G) in a dense reticulin network (H). The fusiform cells are immunonegative for GFAP whereas pleomorphic clear cells within lobules show immunoreactivity (I). Case 2: Hematoxylin and eosin–stained sections show a circumscribed tumor (J). Round cells sometimes with eosinophilic cytoplasm are arranged on a fibrillary matrix. Most of the vessels have a thick hyalinized wall (K). In some areas, large eosinophilic cells form structured sheets interrupted by fibrillary matrix (L). The Gordon Sweet reticulin stain underlines the rich vascular network (M). Strong olig2 expression is observed (N). Diffuse, strong and often dot‐like immunoreactivity for synaptophysin is observed (O).
Case 2
This tumor was mainly composed of monotonous round cells with neurocyte‐like or oligodendrocyte‐like morphology arranged at variable density in a fibrillary background (Figure 2J,K,L and Supporting Information Figure S2A,B). Some eosinophilic cells with large cytoplasm were also present (Figure 2K). In some areas, they formed structured sheets interrupted by fibrillary matrix (Figure 2L). Interface with adjacent brain parenchyma showed a circumscribed tumor (Figure 2J and Supporting Information Figure S2A) and neurofilament proteins immunoreactivity was limited to axons in the periphery of the tumor (Supporting Information Figure S2H). Rare eosinophilic granular bodies were seen. No ganglionic neuronal cells were seen. A rich vascular network was underlined by the Gordon sweet reticulin stain (Figure 2M). The vessels had a thick hyalinized wall (Figure 2K and Supporting Information Figure S2D). An important histological feature was the presence of microcalcifications, sometimes in acellular areas with a network of branching calcified vessels (Supporting Information Figure S2C). Glomeruloid vascular proliferation was focally present (Supporting Information Figure S2E). Mitotic activity was inconspicuous. Ki67 labelling index was under 3% (Supporting Information Figure S2F). Olig2‐expressing cells were observed (Figure 2N). Some cells displayed dot‐like immunoreactivity for synaptophysin (Figure 2O). Chromogranin was negative. Expression of CD34 was observed in some foci with diffuse or cytoplasmic staining (Supporting Information Figure S2G). The histological aspects were consistent with a circumscribed low grade glioma whether pilocytic astrocytoma or more probably ganglioglioma because of the strong CD34 immunostaining. No KIAA‐BRAF fusion and no mutation in BRAF, H3F3A, HIST1H3B and AVCR1 were retrieved.
EWSR1‐PATZ1 fusion transcript
The RNA‐sequencing automatic software pipeline detected EWSR1‐PATZ1 fusion in Case 1 NGS data analysis. No rearrangements of PRKACA, BRAF, FGFR1, FGFR2, FGFR3, MYB1 or MYBL1 genes were present in the fusion report. Spanning reads across the EWSR1‐PATZ1 junction were present and were not replicates but had different starts and ends. These reads allowed us to define the breakpoints on EWSR1 and PATZ1 genes (Figure 3). They were confirmed by Sanger sequencing of EWSR1‐PATZ1 RT‐PCR products in Case 1 (Figure 3). The whole N‐terminal transcriptional activation domain (TAD) from EWSR1 is present in the EWSR‐PATZ1 fusion, in frame with the C‐terminal DNA binding domain of the PATZ1 transcription factor. The RT‐PCR using primers designed around the breakpoint observed by RNA sequencing in Case 1 failed to amplify RNA extracted from Case 2.
Figure 3.
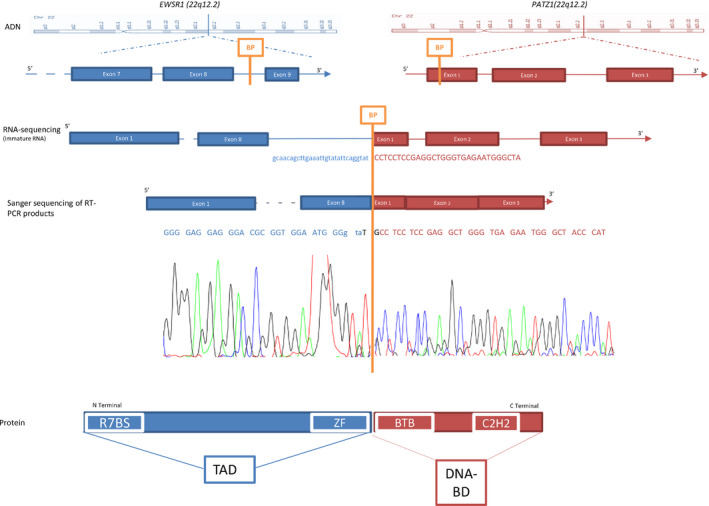
The EWSR1‐PATZ1 fusion gene. Schematic representation of fusion event between EWSR1 (blue) and PATZ1 (red). The two genes EWSR1 and PATZ1 were on the chromosome 22q. Lines and full boxes represented the intron sequence and the sequence coding exons, respectively. An orange strip depicted the fusion point. The RNA sequencing and the Sanger chromatogram were in line with a schematic view of the fusion mRNA. The RNA sequencing corresponded to an immature form of fusion mRNA and juxtaposed intron 8–9 of EWSR1 gene, and the first exon of PATZ1 from the 966th nucleotide. The Sanger chromatogram corresponded to a mature form of fusion mRNA and juxtaposed the exon 8 of EWSR1, a two bases addition and the first exon of PATZ1 from the 966th nucleotide. The protein fusion combined the whole N‐terminal transcriptional activation domain from EWSR1 and C‐terminal DNA binding domain of the PATZ1 transcription factor. BP: break point, R7BS: RNA polymerase II subunit hsRPB7 binding site, ZF: zinc finger domain, TAD: transcriptional activation domain, BTB: Broad‐Complex, Tramtrack and bric‐à‐brac domain, C2H2: C2H2‐type zinc‐finger protein family, DNA‐BD: DNA binding domain, Chr 22: chromosome 22
FISH analysis
As the breakpoint of EWSR1 in EWSR1‐PATZ1 fusion gene is identical to all previously described EWSR1 fusion genes, we used the commercial EWSR1 break‐apart probes already set in our department to be used on FFPE sections The EWSR1 FISH slide of our index case, with a proven EWSR1 breakpoint, was difficult to read: the red and green break‐apart probes were always relatively close to one another and only 15% of nuclei had a split signal defined by a distance of 2 spots between red and green signals. This could be explained by the short interval of around 20 Mb between PATZ1 and EWSR1 loci. To screen the forty BRAFV600E negative gangliogliomas, we chose a 10% cut off assuming some false positive cases (i.e., sensitivity was favored over specificity). In some cases that we called positive, the split signal was difficult to distinguish from a chromatin decompaction or from variation in the pre‐analytic process of the sample.
We found 10 cases with abnormal signals out of 40 BRAFV600E negative gangliogliomas under these conditions. Seven cases with a sufficient amount of tissue were selected for DNA methylation profiling. They did not cluster with Case 1. One out of the seven cases (Case 2) clustered slightly more closely with ganglioglioma than with our index case. We failed to retrieve EWSR1‐PATZ1 fusion by RT‐PCR in this case. FISH using EWSR1 break apart probes is definitely not a good tool to detect the EWSR1‐PATZ1 fusion. EWSR1 and PATZ1 gene loci are too close (20 Mb) to clearly distinguish a split signal from a chromatin decompaction or a fixation artefact.
Expression analysis
We assessed the expression level of EWSR1 and PATZ1 in Case 1 sample using the NGS data. The count of reads overlapping EWSR1 showed that the exomic regions downstream of the breakpoint were dramatically downregulated compared to the ones upstream (Supporting Information Figure S3). On the other hand, the count of reads overlapping PATZ1 showed that the exomic regions downstream of the breakpoint were overexpressed compared to the exon 1 upstream of the breakpoint, indicating that EWSR1‐PATZ1 fusion produced an increase of PATZ1 expression (Supporting Information Figure S3).
DNA methylation profiling
DNA methylation profiles were compared with other low‐grade glioneuronal tumor entities currently covered in the Heidelberg cohort (from the Heidelberg Molecular Neuropathology platform, https://www.molecularneuropathology.org/mnp). Using DNA methylation analysis, the index case showed a methylation profile clearly distinct from that of other low‐grade glioneuronal tumors. Case 2 clustered slightly more closely with ganglioglioma, but showed differences from the main ganglioglioma group and similarities with the index case (Figure 4).
Figure 4.
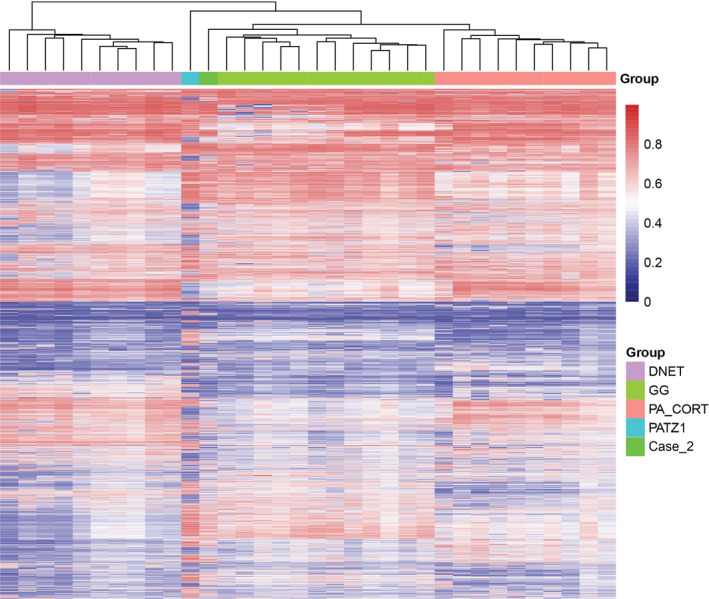
Unsupervised hierarchical clustering using the 10 000 top most variably methylated probes across the cohort for the two test cases and selected reference cases from the Heidelberg Molecular Neuropathology platform (https://www.molecularneuropathology.org/mnp). Samples are colored according to the histological type: ganglioglioma green, cortical pilocytic astrocytoma orange, dysembryoplastic neuroepithelial tumor pink, Case 1 (PATZ1‐fused) turquoise blue and Case 2 light green. Clustering was according to Euclidean distance measures and complete linkage. Each row represents a probe; each column represents a sample. Color scale indicates methylation status (blue: unmethylated, red: methylated).
Copy number profiles were generated using processing of DNA methylation data. Cases 1 and 2 shared copy number variations at 22q12.2 locus, in the vicinity of EWSR1 and PATZ1. In Case 1, a chromosomal breakpoint was observed in the vicinity of the PATZ1 locus. In Case 2, several focal and larger‐scale copy number alterations were observed around the PATZ1 and EWSR1 loci as well as elsewhere on chromosome 22 (Supporting Information Figure S4).
Discussion
For the last ten years, NGS has allowed the rapid discovery of new molecular alterations that ascertain the diagnosis of several glioneuronal tumors. Some alterations are pathognomonic for a tumor entity as SLC44A1‐PRKCA fusion gene for PGNT 3, 16, 18; others are associated with two or more entities, as FGFR1 mutations associated at least with DNET, rosette forming glioneuronal tumor and pilocytic astrocytoma 13, 22. It seems crucial to put our Case 1 into the molecular context of glioneuronal tumors 2, 3, 11, 13, 19, 20, 21, 22, 23. No fusions were detected involving PRKCA, BRAF, FGFR1, FGFR2, FGFR3, MYB1 or MYBL1 genes although those genes were present in the capture panel of the TruSight RNA fusion kit. SLC44A1‐PRKCA fusion was shown to be a robust genetic signature of PGNT 16. Since the first report of PGNT in 2012, only FGFR1N546K mutation has been proposed as an alternative diagnostic marker in PGNT 8. It is unlikely that EWSR1‐PATZ1 fusion represents a novel signature in those tumors. With regard to morphology, in Case 1 the tumor cells were not always regularly arranged around blood vessels as is the case in PGNT and no papillary features were observed in Case 2. Studies of large brain tumor cohorts by thorough NGS including RNA sequencing had reported the EWSR1‐PATZ1 fusion only three times in exclusively molecular studies: in one tumor referred to as a grade I BRAFV600E negative ganglioglioma in a series of 91 pediatric and young adult low grade neuroepithelial tumors, in one glioneuronal tumor not otherwise specified (NOS) in a series of 26 adult glioneuronal tumors, and in one high grade glioma NOS in a series of 282 pediatric gliomas 1, 10, 19. These data underline the rarity of this chromosomic rearrangement in CNS tumors.
We performed genome wide DNA methylation assay to define whether EWSR1‐PATZ1 fusion was a new molecular finding in a known CNS tumor entity, in particular ganglioglioma, or may rather define a new CNS tumor entity. This method is accurate and robust for classification into tumor subgroups. It has been recently largely used to refine CNS tumor classification 9, 25. Using DNA methylation analysis, our index case had a new profile, distinct from other profiles of low grade glioneuronal tumors. A pediatric intraventricular ganglioglioma (Case 2) clustered slightly more closely with ganglioglioma, possibly due to a lower tumor purity, but showed differences from the main ganglioglioma group and similarities with the index case. Both cases shared copy number variations at 22q12.2 locus, in the vicinity of EWSR1 and PATZ1. But in Case 2, copy number variations were numerous and complex at 22q12.2, and could correspond to a more complex rearrangement.
Case 1 DNA methylation profiling argues for a new glioneuronal tumor entity molecularly defined by PATZ1 fusion. The recent work by Watson et al reinforces this hypothesis. These authors performed an unbiased and systematic search for gene fusions combined with unsupervised expression analysis in a series of 184 small round cell sarcomas. They showed that EWSR1‐PATZ1 fusion defined a homogeneous group based on expression profiles 29. The histological features of the 5 EWSR1‐PATZ1 fused sarcomas were heterogeneous. Nevertheless, all five tumors tightly clustered together and away from other EWSR1 fused sarcomas, indicative of a transcriptionally different entity 29. One of the five sarcomas had several vessels forming a “haemangioma‐like” vasculature reminiscent of the very dense and hyaline vasculature in our cases. Another sarcoma had nests of epithelioid cells akin to some aspects of our index case with clear cells surrounded by a rich reticulin network. Nevertheless, our index case, with olig2 and synaptophysin ummunopositivity, as well as the three previously reported CNS cases are clearly primitive brain tumors and therefore different from this new soft tissue tumor entity 1, 10, 19. But, the results by Watson et al reinforce the idea that EWSR1‐PATZ1 fusion is a strong molecular signature leading to a specific expression profile likely to define a new CNS tumor entity 29.
The EWSR1‐PATZ1 fusion gene that we observed is similar to other EWSR1 oncogenic fusions. These fusions occur between EWSR1 gene and various genes encoding transcription factors, often belonging to the E26 transformation‐specific (ETS) gene family, involved in Ewing sarcoma 12, 27. PATZ1 is also a transcription factor but from the BTB‐ZF (broad‐complex, tramtrack and bric‐à‐brac ‐ zinc finger) gene family 24. As in all previously described EWSR1‐PATZ1 gene fusions, the whole N‐terminal transcriptional activation domain (TAD) from EWSR1 (corresponding to amino acids 1 to 264) is present in the EWSR‐PATZ1 fusion gene, in frame with the C‐terminal DNA binding domain of the PATZ1 transcription factor 1, 10, 14, 19, 29. The oncogenicity of EWSR1 gene fusions seems obvious but the underlying physiopathological mechanisms are still under investigation 12. The changes in gene expression are very complex, depending on the fusion partner and the cell of origin of the cancer 12, 27. Moreover, transcriptional changes are just one aspect of the consequences of EWSR1 gene fusion. In fact, EWSR1 is a multifunctional protein acting also in DNA‐recombination, DNA pairing, DNA‐repair, mRNA splicing and transport, G‐protein signaling and even in mitotic regulation by dynamically influencing microtubule acetylation 27, 28. We showed that the exons of PATZ1 after the breakpoint are clearly overexpressed. This BTB‐ZF transcription factor is an important regulator of pluripotency in embryonal stem cells repressing developmental genes through its BTB domain 17. PATZ1 directly regulates Pou5f1 and Nanog. PATZ1 is essential to maintaining stemness by inhibiting neural differentiation 17.
With NGS massive parallel sequencing, fusion genes are better detected and, surprisingly, EWSR1 fusions, that we could have thought to be relatively specific to soft tissue and epithelial head and neck tumors, are discovered in primary CNS tumors. As EWSR1 overexpression has not been described intrinsically as oncogenic, EWSR1 fusions may help identify transcription factor partners likely to be oncogenic. It could shed light on still poorly known proteins as PATZ1. An EWSR1‐PLAGL1 fusion was identified in an atypical teratoid rhabdoid tumor 21. Of interest, EWSR1 was fused with BEND2 in a spinal ependymoma 21. BEND2 gene is very poorly described and could be a clue to oncogenetic pathways as BEND2 has also been reported in an MN1‐BEND2 fusion by Sturm et al in their MN1 subgroup of primitive neuroectodermal tumors of the CNS (CNS‐PNETs) 26. These authors reported rearrangements involving EWSR1 in three cases of CNS‐PNETs but they did not precise the kind of rearrangements or the names of the potential EWSR1 partners in their publication.
Conclusion
The identification of EWSR1 gene fusion in CNS tumors shed light on the fusion partners. Unlike most classic fusion oncogenes, where a tightly regulated gene is overexpressed through promoter swapping or is constitutively activated, EWSR1 fusion oncogene has far more complex consequences. The partners involved in EWSR1 gene fusion, as PATZ1 in our study, are of particular interest since they may lead to a better understanding of oncogenesis and become new therapeutic targets.
With NGS and especially RNA sequencing, new candidate fusion oncogenes are being identified in CNS tumors. For each fusion, as for the novel EWSR1‐PATZ1 fusion, the specificity for a given tumor entity remains to be assessed but DNA methylation profiling suggested that this EWSR1‐PATZ1 gene fusion might define a new cluster distinct from low grade glioma including ganglioglioma. If confirmed in a larger series, this specific methylation profile, the ventricular location and the glioneuronal morphology may argue for a new tumor entity.
Supporting information
Figure S1. Histopathological illustrations for Case 1. Tumoral cells with clear cytoplasm form either patternless sheets (left) or lobules delimited by fusiform astrocyte‐like cells (right) (A). Irregular or even pleomorphic hyperchromatic nuclei are observed in clear cells. Surrounding fusiform astrocyte‐like cells show more regular and fusiform nuclei (B). Same area and magnification than “A”: patternless sheets (left) and lobules of clear cells (right) are immunoreactive for GFAP, whereas areas with fusiform cells are negative (right) (C). The fusiform cells are also immunonegative for PS100 whereas pleomorphic clear cells within lobules show strong immunoreactivity (D). Outside the dense reticulin‐rich lobular areas, pleomorphic clear cells with some large nuclei are observed (E, F). Marked hyalinization of tumor vessels is observed (G). MIB‐1 labelling index is always under 3% (H).
Figure S2. Histopathological illustrations for Case 2. Hematoxylin and eosin–stained sections show a relatively well circumscribed tumor even when cellular density is low (A). In these looser areas, oligodendrocyte‐like cells are arranged on a fibrillary matrix (B). Network of branching calcified vessels (C). Vessels with a thick hyalinized wall (D). Glomeruloid vascular proliferation is present (left) in addition to a rich endocrinoid vascular network (E). Low Ki67 labelling index (F). Expression of CD34 in some areas with extravascular diffuse or cytoplasmic staining (G). Neurofilament proteins immunoreactivity is limited to axons in the periphery of the tumor (H).
Figure S3. Read counts to estimate EWSR1 and PATZ1 expression levels. (A) for each exon of EWSR1, the median of read counts at each nucleotide along the exon is represented by a thick horizontal bar in a box with the lower edge being the 25th percentile and the upper edge the 75th percentile. The lower bar under the box is the minimal read count and the higher bar above the box is the highest read count. A dramatic decrease of read counts is observed in the exons after the breakpoint, reflecting a huge decrease in EWSR1 expression. (B) same representation as (A) for PATZ1. As the breakpoint is localized in exon 1, the read counts for exon 1 have been splited into two boxes representing exon 1 before the breakpoint and exon 1 after the breakpoint. An increase in read counts is clearly observed after the breakpoint, reflecting an overexpression of PATZ1.
Figure S4. Copy number profiles generated by processing of DNA methylation data. Case 1: A chromosomal breakpoint was observed in the vicinity of the PATZ1 locus. Case 2: Several focal and larger‐scale copy number alterations were observed around the PATZ1 and EWSR1 loci as well as elsewhere on chromosome 22.
Acknowledgments
D. Jones is supported by funding for the Everest Centre for Paediatric Low‐Grade Brain Tumour Research through the Brain Tumour Charity (UK). We are grateful to Karen Silva for her help in handling tumor samples from the different pathological departments. Samples from Marseille were retrieved from the AP‐HM tumor bank AC 2017:1786. Samples from Toulouse were retrieved from the CHU de Toulouse tumor bank BB‐0033‐00014.
References
- 1. Alvarez‐Breckenridge C, Miller JJ, Nayyar N, Gill CM, Kaneb A, D'Andrea M et al (2017) Clinical and radiographic response following targeting of BCAN‐NTRK1 fusion in glioneuronal tumor. NPJ Precis Oncol 1:Article number: 5 ISSN 2397‐768X (online). [DOI] [PMC free article] [PubMed] [Google Scholar]
- 2. Bandopadhayay P, Ramkissoon LA, Jain P, Bergthold G, Wala J, Zeid R et al (2016) MYB‐QKI rearrangements in angiocentric glioma drive tumorigenicity through a tripartite mechanism. Nat Genet 48:273–282. [DOI] [PMC free article] [PubMed] [Google Scholar]
- 3. Bridge JA, Liu XQ, Sumegi J, Nelson M, Reyes C, Bruch LA et al (2013) Identification of a novel, recurrent SLC44A1‐PRKCA fusion in papillary glioneuronal tumor. Brain Pathol 23:121–128. [DOI] [PMC free article] [PubMed] [Google Scholar]
- 4. Chappé C, Padovani L, Scavarda D, Forest F, Nanni‐Metellus I, Loundou A et al (2013) Dysembryoplastic neuroepithelial tumors share with pleomorphic xanthoastrocytomas and gangliogliomas BRAF(V600E) mutation and expression. Brain Pathol 23:574–583. [DOI] [PMC free article] [PubMed] [Google Scholar]
- 5. Chen X, Schulz‐Trieglaff O, Shaw R, Barnes B, Schlesinger F, Källberg M et al (2016) Manta: rapid detection of structural variants and indels for germline and cancer sequencing applications. Bioinformatics 32:1220–1222. [DOI] [PubMed] [Google Scholar]
- 6. Dobin A, Davis CA, Schlesinger F, Drenkow J, Zaleski C, Jha S et al (2013) STAR: ultrafast universal RNA‐seq aligner. Bioinformatics 29:15–21. [DOI] [PMC free article] [PubMed] [Google Scholar]
- 7. Dougherty MJ, Santi M, Brose MS, Ma C, Resnick AC, Sievert AJ et al (2010) Activating mutations in BRAF characterize a spectrum of pediatric low‐grade gliomas. Neuro Oncol 12:621–630. [DOI] [PMC free article] [PubMed] [Google Scholar]
- 8. Gessi M, Abdel Moneim Y, Hammes J, Waha A, Pietsch T (2014) FGFR1 N546K mutation in a case of papillary glioneuronal tumor (PGNT). Acta Neuropathol 127:935–936. [DOI] [PubMed] [Google Scholar]
- 9. Hovestadt V, Remke M, Kool M, Pietsch T, Northcott PA, Fischer R et al (2013) Robust molecular subgrouping and copy‐number profiling of medulloblastoma from small amounts of archival tumour material using high‐density DNA methylation arrays. Acta Neuropathol 125:913–916. [DOI] [PMC free article] [PubMed] [Google Scholar]
- 10. Johnson A, Severson E, Gay L, Vergilio JA, Elvin J, Suh J et al (2017) Comprehensive genomic profiling of 282 pediatric low‐ and high‐grade gliomas reveals genomic drivers, tumor mutational burden, and hypermutation signatures. Oncologist 22:1478–1490. [DOI] [PMC free article] [PubMed] [Google Scholar]
- 11. Kitamura Y, Komori T, Shibuya M, Ohara K, Saito Y, Hayashi S et al (2018) Comprehensive genetic characterization of rosette‐forming glioneuronal tumors: independent component analysis by tissue microdissection. Brain Pathol 28:87–93. [DOI] [PMC free article] [PubMed] [Google Scholar]
- 12. Kovar H, Amatruda J, Brunet E, Burdach S, Cidre‐Aranaz F, de Alava E et al (2016) The second European interdisciplinary Ewing sarcoma research summit–A joint effort to deconstructing the multiple layers of a complex disease. Oncotarget 23:8613–8624. [DOI] [PMC free article] [PubMed] [Google Scholar]
- 13. Louis DN, Ohgaki H, Wiestler OD, Cavenee WK (2016) WHO Classification of Tumours of the Central Nervous System, Revise 4th edn. IARC Press: Lyon. [Google Scholar]
- 14. Mastrangelo T, Modena P, Tornielli S, Bullrich F, Testi MA, Mezzelani A et al (2000) A novel zinc finger gene is fused to EWS in small round cell tumor. Oncogene 19:3799–3804. [DOI] [PubMed] [Google Scholar]
- 15. Momota H, Shimoyama Y (2015) Recurrent papillary glioneuronal tumor presenting as a ganglioglioma with the BRAF V600E mutation. Neuropathology 35:603–605. [DOI] [PubMed] [Google Scholar]
- 16. Nagaishi M, Nobusawa S, Matsumura N, Kono F, Ishiuchi S, Abe T et al (2016) SLC44A1‐PRKCA fusion in papillary and rosette‐forming glioneuronal tumors. J Clin Neurosci 23:73–75. [DOI] [PubMed] [Google Scholar]
- 17. Ow JR, Ma H, Jean A, Goh Z, Lee YH, Chong YM et al (2014) Patz1 regulates embryonic stem cell identity. Stem Cells Dev 23:1062–1073. [DOI] [PubMed] [Google Scholar]
- 18. Pages M, Lacroix L, Tauziede‐Espariat A, Castel D, Daudigeos‐Dubus E, Ridola V et al (2015) Papillary glioneuronal tumors: histological and molecular characteristics and diagnostic value of SLC44A1‐PRKCA fusion. Acta Neuropathol Commun 3:85. [DOI] [PMC free article] [PubMed] [Google Scholar]
- 19. Qaddoumi I, Orisme W, Wen J, Santiago T, Gupta K, Dalton JD et al (2016) Genetic alterations in uncommon low‐grade neuroepithelial tumors: BRAF, FGFR1, and MYB mutations occur at high frequency and align with morphology. Acta Neuropathol 131:833–845. [DOI] [PMC free article] [PubMed] [Google Scholar]
- 20. Ramkissoon LA, Horowitz PM, Craig JM, Ramkissoon SH, Rich BE, Schumacher SE et al (2013) Genomic analysis of diffuse pediatric low‐grade gliomas identifies recurrent oncogenic truncating rearrangements in the transcription factor MYBL1. Proc Natl Acad Sci USA 110:8188–8193. [DOI] [PMC free article] [PubMed] [Google Scholar]
- 21. Ramkissoon SH, Bandopadhayay P, Hwang J, Ramkissoon LA, Greenwald NF, Schumacher SE et al (2017) Clinical targeted exome‐based sequencing in combination with genome‐wide copy number profiling: precision medicine analysis of 203 pediatric brain tumors. Neuro Oncol 19:986–996. [DOI] [PMC free article] [PubMed] [Google Scholar]
- 22. Rivera B, Gayden T, Carrot‐Zhang J, Nadaf J, Boshari T, Faury D et al (2016) Germline and somatic FGFR1 abnormalities in dysembryoplastic neuroepithelial tumors. Acta Neuropathol 131:847–863. [DOI] [PMC free article] [PubMed] [Google Scholar]
- 23. Schindler G, Capper D, Meyer J, Janzarik W, Omran H, Herold‐Mende C et al (2011) Analysis of BRAF V600E mutation in 1,320 nervous system tumors reveals high mutation frequencies in pleomorphic xanthoastrocytoma, ganglioglioma and extra‐cerebellar pilocytic astrocytoma. Acta Neuropathol 121:397–405. [DOI] [PubMed] [Google Scholar]
- 24. Siggs OM, Beutler B (2012) The BTB‐ZF transcription factors. Cell Cycle 11:3358–3369. [DOI] [PMC free article] [PubMed] [Google Scholar]
- 25. Sturm D, Witt H, Hovestadt V, Khuong‐Quang DA, Jones DT, Konermann C et al (2012) Hotspot mutations in H3F3A and IDH1 define distinct epigenetic and biological subgroups of glioblastoma. Cancer Cell 22:425–437. [DOI] [PubMed] [Google Scholar]
- 26. Sturm D, Orr BA, Toprak UH, Hovestadt V, Jones DTW, Capper D et al (2016) New brain tumor entities emerge from molecular classification of CNS‐PNETs. Cell 164:1060–1072. [DOI] [PMC free article] [PubMed] [Google Scholar]
- 27. Todorova R (2015) Structure‐function based molecular relationships in Ewing's sarcoma. Biomed Res Int 2015:1. [DOI] [PMC free article] [PubMed] [Google Scholar]
- 28. Wang YL, Chen H, Zhan YQ, Yin RH, Li CY, Ge CH et al (2016) EWSR1 regulates mitosis by dynamically influencing microtubule acetylation. Cell Cycle 15:2202–2215. [DOI] [PMC free article] [PubMed] [Google Scholar]
- 29. Watson S, Perrin V, Guillemot D, Reynaud S, Coindre JM, Karanian M, et al (2018) Transcriptomic definition of molecular subgroups of small round cell sarcomas. J Pathol 245:29–40. [DOI] [PubMed] [Google Scholar]
Associated Data
This section collects any data citations, data availability statements, or supplementary materials included in this article.
Supplementary Materials
Figure S1. Histopathological illustrations for Case 1. Tumoral cells with clear cytoplasm form either patternless sheets (left) or lobules delimited by fusiform astrocyte‐like cells (right) (A). Irregular or even pleomorphic hyperchromatic nuclei are observed in clear cells. Surrounding fusiform astrocyte‐like cells show more regular and fusiform nuclei (B). Same area and magnification than “A”: patternless sheets (left) and lobules of clear cells (right) are immunoreactive for GFAP, whereas areas with fusiform cells are negative (right) (C). The fusiform cells are also immunonegative for PS100 whereas pleomorphic clear cells within lobules show strong immunoreactivity (D). Outside the dense reticulin‐rich lobular areas, pleomorphic clear cells with some large nuclei are observed (E, F). Marked hyalinization of tumor vessels is observed (G). MIB‐1 labelling index is always under 3% (H).
Figure S2. Histopathological illustrations for Case 2. Hematoxylin and eosin–stained sections show a relatively well circumscribed tumor even when cellular density is low (A). In these looser areas, oligodendrocyte‐like cells are arranged on a fibrillary matrix (B). Network of branching calcified vessels (C). Vessels with a thick hyalinized wall (D). Glomeruloid vascular proliferation is present (left) in addition to a rich endocrinoid vascular network (E). Low Ki67 labelling index (F). Expression of CD34 in some areas with extravascular diffuse or cytoplasmic staining (G). Neurofilament proteins immunoreactivity is limited to axons in the periphery of the tumor (H).
Figure S3. Read counts to estimate EWSR1 and PATZ1 expression levels. (A) for each exon of EWSR1, the median of read counts at each nucleotide along the exon is represented by a thick horizontal bar in a box with the lower edge being the 25th percentile and the upper edge the 75th percentile. The lower bar under the box is the minimal read count and the higher bar above the box is the highest read count. A dramatic decrease of read counts is observed in the exons after the breakpoint, reflecting a huge decrease in EWSR1 expression. (B) same representation as (A) for PATZ1. As the breakpoint is localized in exon 1, the read counts for exon 1 have been splited into two boxes representing exon 1 before the breakpoint and exon 1 after the breakpoint. An increase in read counts is clearly observed after the breakpoint, reflecting an overexpression of PATZ1.
Figure S4. Copy number profiles generated by processing of DNA methylation data. Case 1: A chromosomal breakpoint was observed in the vicinity of the PATZ1 locus. Case 2: Several focal and larger‐scale copy number alterations were observed around the PATZ1 and EWSR1 loci as well as elsewhere on chromosome 22.