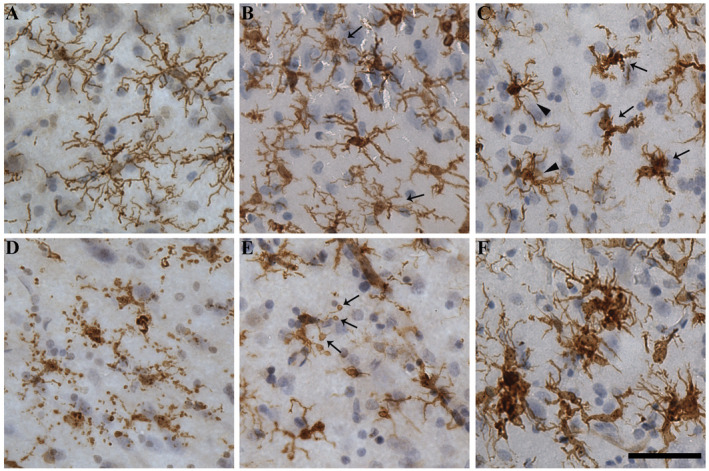
Figure 2.

Microglial morphologies. Representative photomicrographs from the ITC show exemplars of microglial subtypes quantified here. A. Ramified microglia seen in a control case (M20) have small, spherical soma and symmetrically distributed, thin, highly branched processes. B. Activated microglia in an AD case (M09) that are hypertrophied and have reduced branching compared to ramified microglia. Arrows indicate ramified microglia for comparison. C. Activated microglia that are ameboid in morphology (arrows) are seen among other activated cells (arrow heads) in another AD case (M11). D. Dystrophic microglia that are pseudo‐fragmented with discontinuous IBA1 staining of processes in the same AD case (M11). E. A dystrophic microglia that is deramified and has spheroidal swellings at the end of its processes (arrows) from an AD case (M13). F. Clusters of activated microglia seen in an AD case (M09). Nuclei counterstained with hematoxylin. Scale bar = 50 μm.
