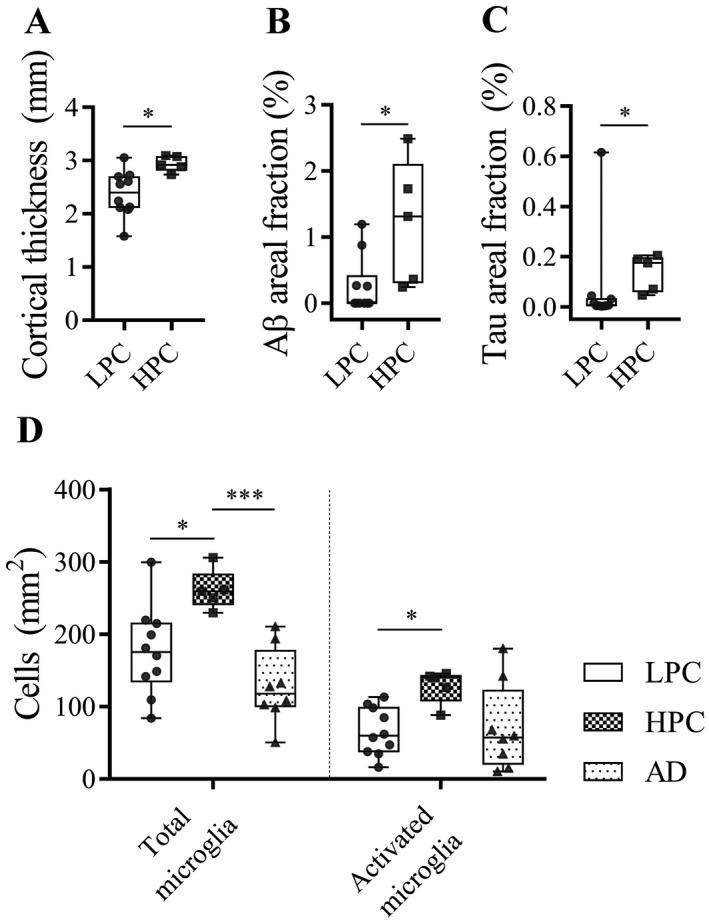
Figure 3.

Comparisons between low pathology controls (LPCs) and high‐pathology controls (HPCs). A. HPCs had thicker cortices, elevated Aβ (B) and tau areal staining (C) compared to LPCs in the ITC. D. Total and activated microglia were also higher in HPCs compared to LPCs.
