
Figure 4.
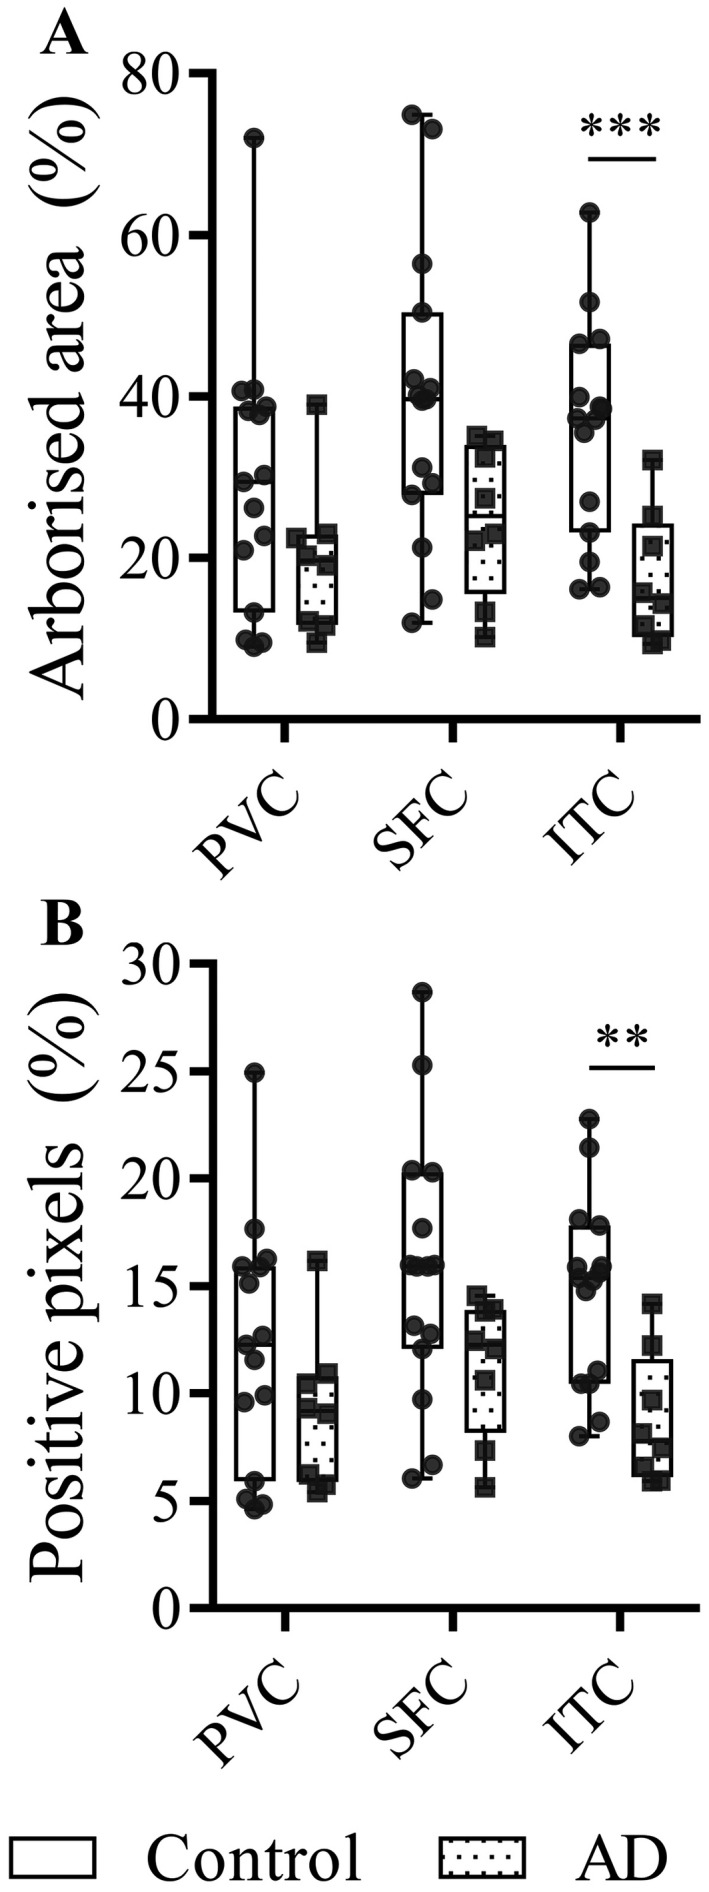
Microglial arborized area. Box and whisker plots demonstrating the area of tissue covered by microglial processes as determined using the convex hull analysis (A) and IBA1 positive pixel analysis (B) in the PVC, SFC and ITC of AD cases and controls.