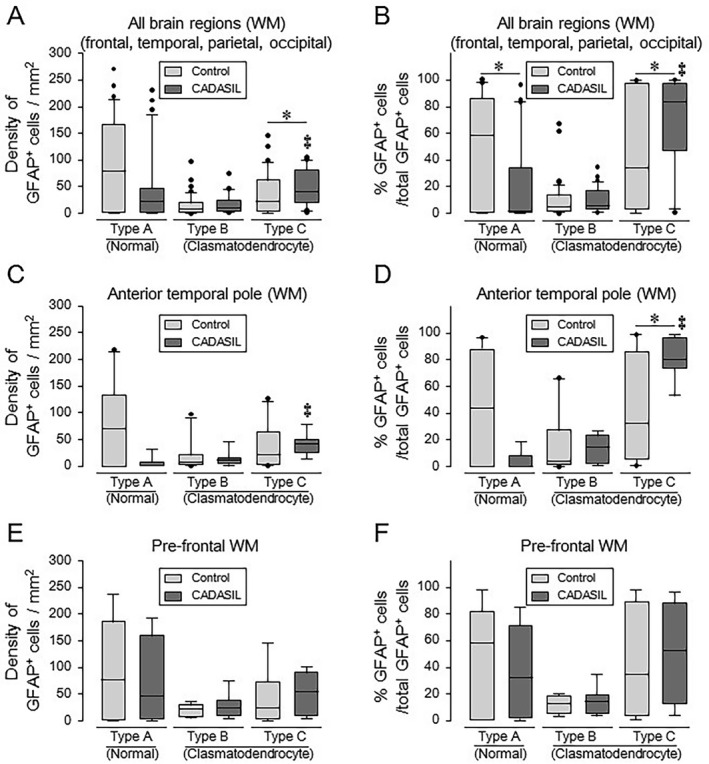
Figure 3.

Quantitative analyses of the total population of GFAP‐positive cells in CADASIL and controls. (A–F) Box plots showing density of GFAP‐positive each type of cells averaged from all brain regions (A), anterior temporal pole (C), and pre‐frontal WM (E) as well as percentage of GFAP‐positive each type of cell per total GFAP‐positive cells averaged from all brain regions (B), anterior temporal pole (D), and pre‐frontal WM (F). Compare to controls, CADASIL subjects showed increased density of abnormal type C cells in all brain regions (A) (*P = 0.037) and increased percentage of abnormal type C cells in all brain regions (B) (*P = 0.046) and the anterior temporal pole (D) (*P = 0.011). When comparing each type of cell among CADASIL subjects, both density and percentage of abnormal type C cells were increased in all brain regions (A and B) and the anterior temporal pole (C and D) (‡ P < 0.01 throughout). However, differences between CADASIL and controls in the pre‐frontal WM did not reach statistical significance (E and F). There was relatively low abundance of type B cells in the same screened regions. Other regions including the temporal, parietal and occipital WM similarly showed differences in percentage of abnormal to normal cells compared to controls (not shown).
