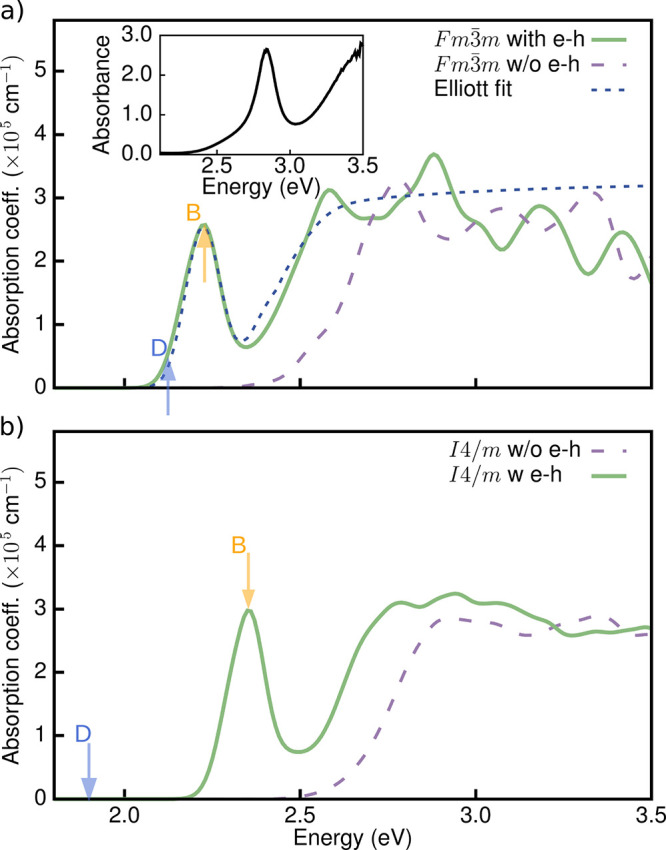
Figure 2.

(a) Optical absorption spectrum of the cubic Fm3̅m phase of Cs2AgBiBr6, calculated using the random phase approximation (RPA) (purple dashed line), the GW+BSE approach (green solid line), and using the Elliott model (dark blue dashed line), experimental optical absorption spectrum with data from ref (28) (inset). (b) Optical absorption spectrum of tetragonal I4/m phase of Cs2AgBiBr6, calculated using the RPA (purple dashed line) and the GW+BSE approach (green solid line). The blue (orange) arrow marks the first dark (bright) transition D (B). RPA optical spectra do not include local field effects.
