
Figure 3.
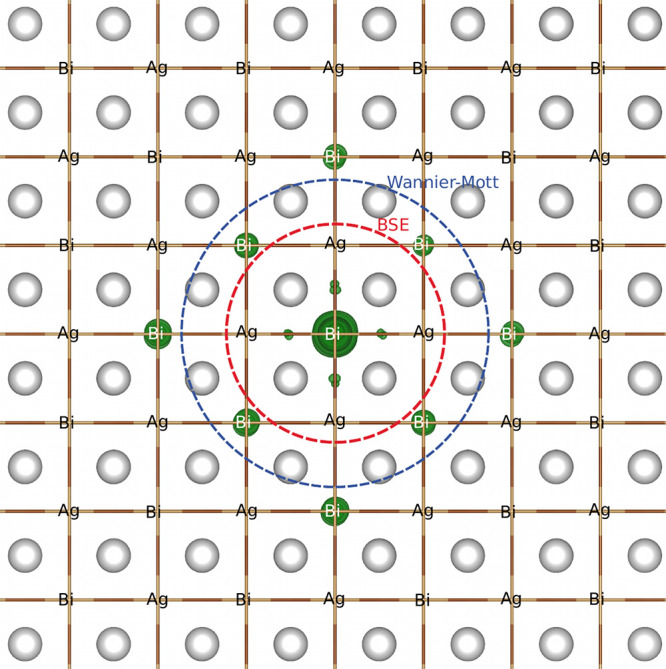
3D representation of the probability density of the exciton wave function in real space (depicted as green isosurfaces), showing 95% of the maximum isovalue. The position of the hole is fixed on a Bi ion, and the circles represent the average electron–hole separation as computed from first-principles (red) and the Wannier–Mott model (blue). The silver spheres are Cs.