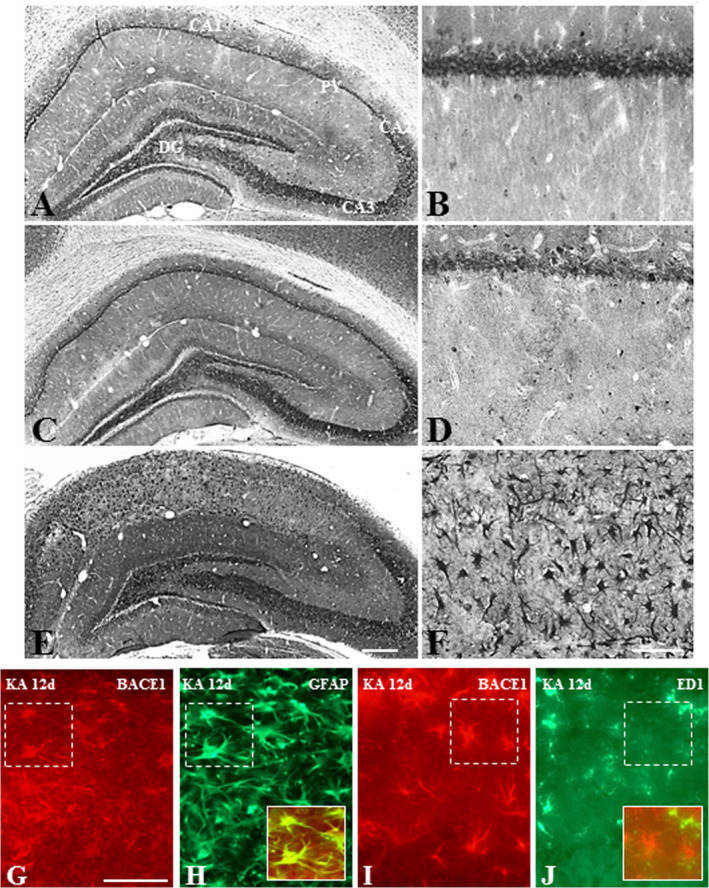
Figure 5.

A–F. Photomicrographs depicting cellular distribution of BACE1 in the hippocampus of control (A, B) and following 12 h (C, D) and 12day (E, F) kainic acid‐treated rats at lower (A, C, E) and higher (B, D, F) magnifications. Note the expression of BACE1 in pyramidal and granule cell layers in control rats, whereas after 12 day kanic acid treatment BACE1 is evident mostly in glial cells of the hippocampus. G–J. Double immunofluorescence photomicrographs showing a subset of GFAP‐labeled astrocytes (G, H), but not ED1‐labeled microglia (I, J), exhibit immunoreactive BACE1 in 12 day kainic acid‐treated rat. Py, pyramidal cell layer; DG, dentate gyrus. Scale bar, 100 µM.
