
Figure 8.
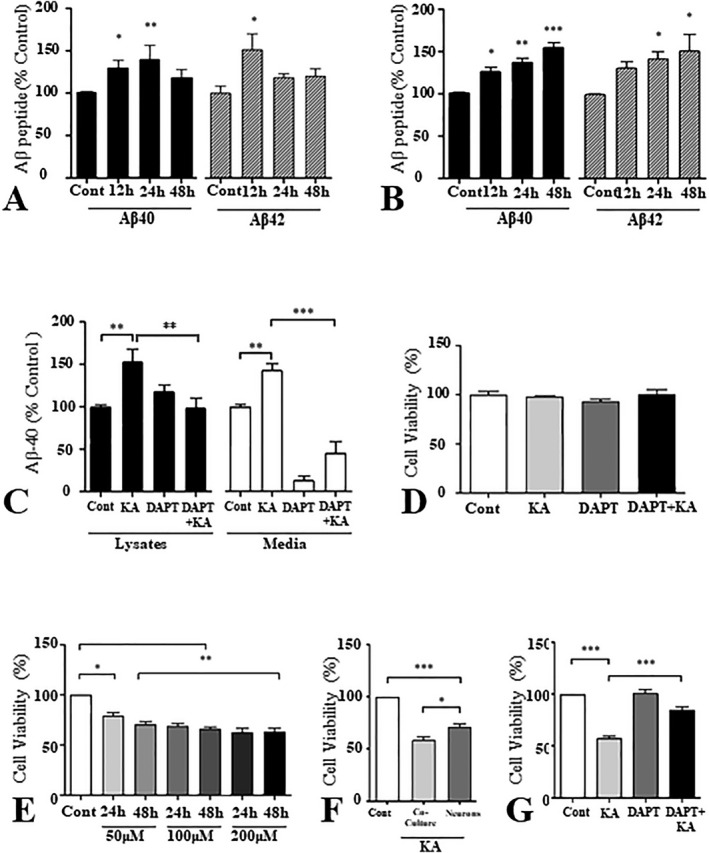
A and B. Histograms showing the alteration in Aβ1–40 and Aβ1–42 levels in cell lysates (A) and media (B) of rat primary astrocytes treated with 100 µM of kainic acid over 12 h, 24 h and 48 h relative to control (Cont). Both Aβ1–40 and Aβ1–42 show a significant increase in the cell lysates as well as in the media following kainic acid treatment. C. Histogram depicting the levels of Aβ1–40 in primary rat astrocyte cultures treated with either kainic acid, γ‐secretase inhibitor DAPT, or a combination of the two (DAPT + KA) relative to control. Note that DAPT drastically reverses the increase in Aβ1–40 levels triggered by kainic acid and this effect is especially prominent in the conditioned media. D. Histogram showing no change in the viability of cultured astrocytes following treatment with kainic acid, DAPT or DAPT + kainic acid, as measured by an MTT assay. E. Histogram showing the effect of kainic acid on the viability of rat primary hippocampal cultured neurons as assessed by an MTT assay. Kainic acid was found to be toxic to neurons in relation to control. F. Histogram showing viability of kainic acid‐treated neuron/astrocyte co‐cultures and pure neuronal cultures compared to control. G. Histogram showing the viability of neuron/astrocyte co‐cultures in relation to control following treatment with kainic acid, DAPT and DAPT + kainic acid. Kainic acid‐induced death of neurons was attenuated by DAPT pretreatment. All cultured data represent means±SEM from 3–4 independent experiments. *P < 0.05, **P < 0.01, ***P < 0.001.