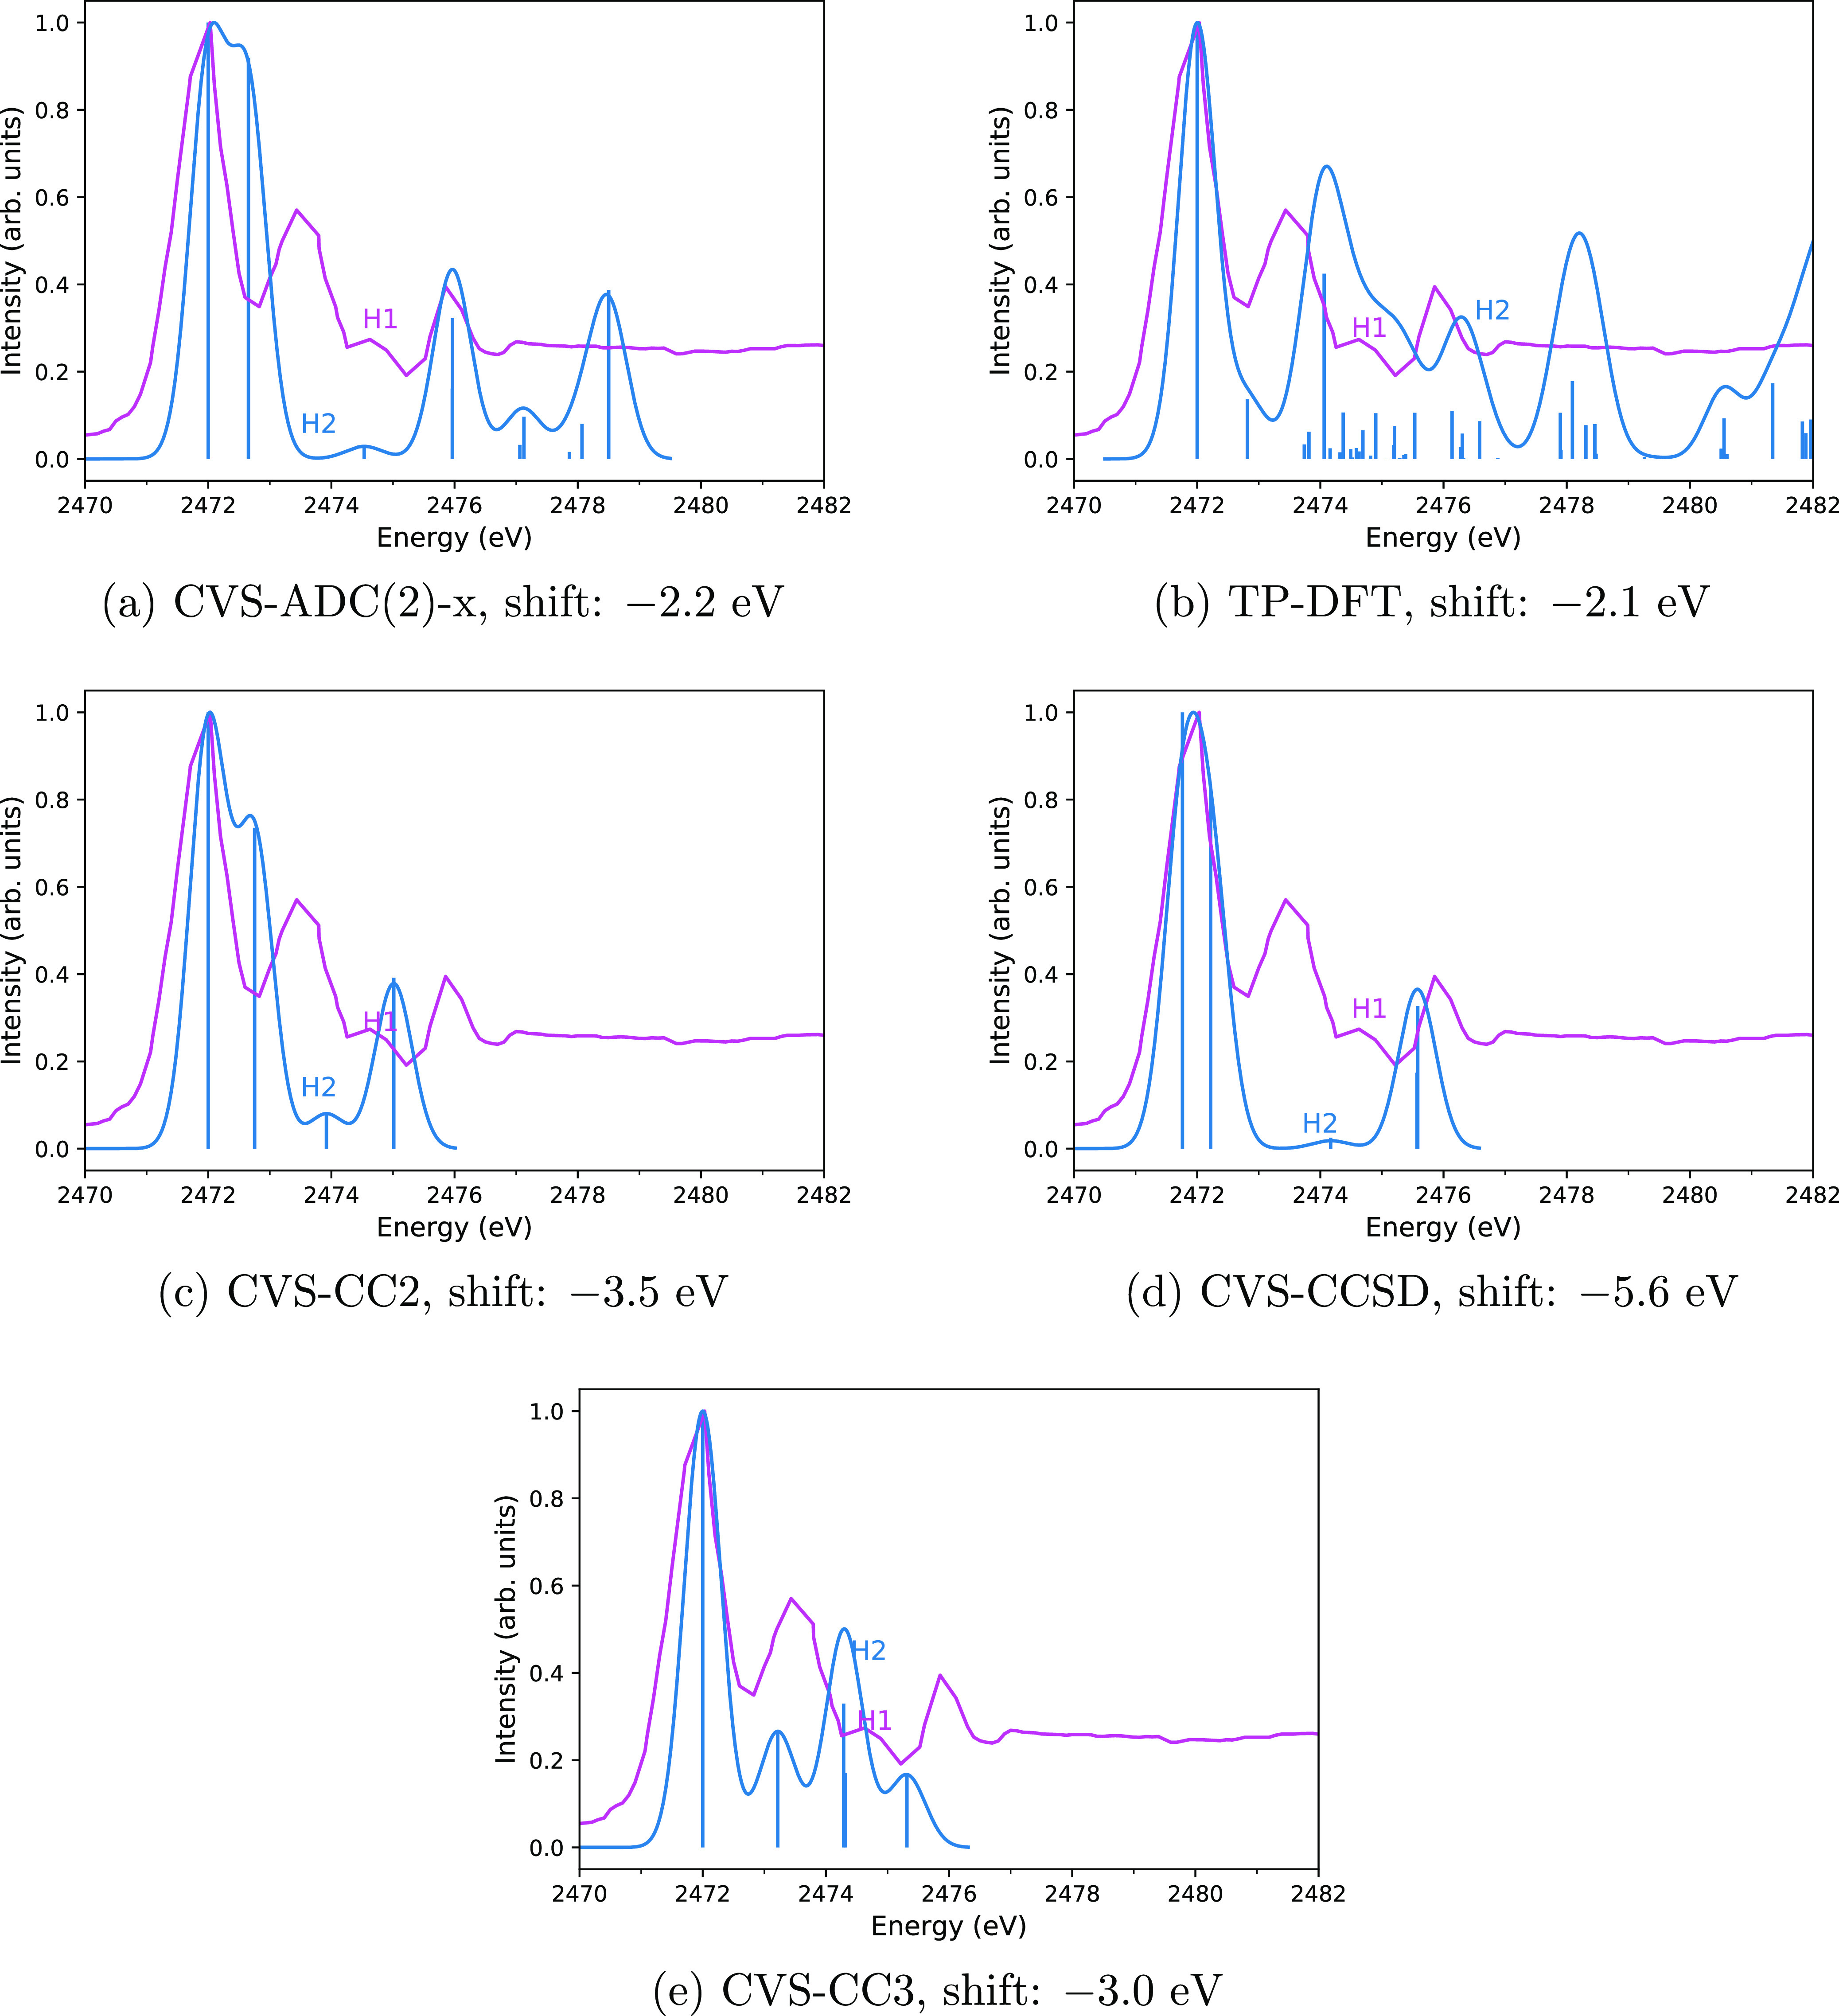
Figure 3.

Comparison of computed (blue) and experimental (magenta) spectra of OCS with the CVS-ADC(2)-x (a), TP-DFT (b), CVS-CC2 (c), CVS-CCSD (d), and CVS-CC3 (e) methods. Computed spectra are translated by the amount shown in the captions to align the main peak to the experiment. Vertical lines represent the calculated spectra, whereas the curves are the theoretical spectra broadened for lifetime and detector resolution effects to mimic the shape of the experimental spectrum closely as possible. The experimental spectrum of OCS adapted with permission from Perera and LaVilla89 (copyright 1984 published by AIP). The letter H was used in the measured spectra by Perera and LaVilla89 to label the third peak with a small intensity.
