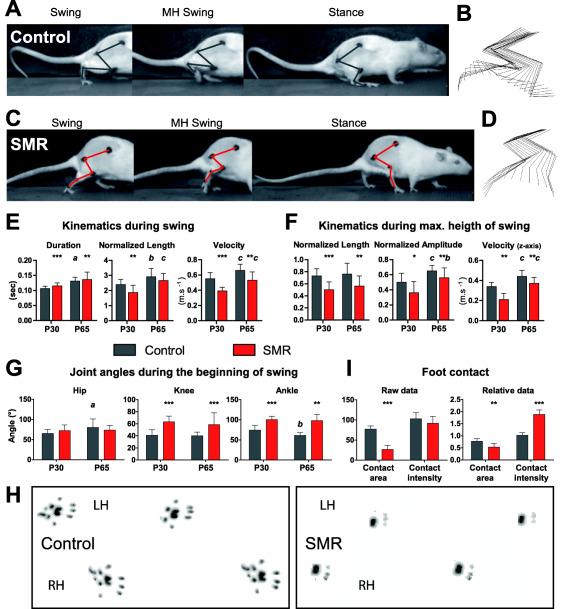
Figure 3.

Illustration of 3D kinematics during treadmill locomotion at P65 and footprints in controls and rats that underwent sensorimotor restriction (SMR). A,C. Photographs of the three phases (beginning of the swing, maximal height of the swing—MH swing—and beginning of the stance) to show hind limb joint angles in representative control and SMR rats, respectively. B,D. Stick reconstruction of the right hind limb movements in the lateral plan during three representative swings in the same control and SMR rats as in A and C. E–G. Plots of the main changes in kinematic variables and joint angles induced by SMR during treadmill locomotion. The duration of the swing was longer in SMR rats than in control rats at P30 (t = 5.54; d.f. = 20; P < 0.0001) and P65 (t = 2.69; d.f. = 21; P < 0.01). At P30, the normalized lengths of the swing (E: t = 2.99; d.f. = 20; P < 0.01) and MH swing (F: t = 4.26; d.f. = 20; P < 0.001) phases were shorter in SMR rats compared with control rats while only that of the MH swing was still shorter after SMR at P65 (F: t = 2.79; d.f. = 21; P < 0.01). The normalized amplitude of the foot during the MH swing was lower in SMR than in control rats whether of the age (F: P30, t = 2.42; d.f. = 20; P < 0.05; P65, t = 1.99; d.f. = 21; P < 0.05). Velocities showed in E and F were reduced as well in SMR rats compared with controls at both ages. The angle of the hip did not differ significantly between the two groups of rats whatever the phase and age, whereas the angles of the knee and ankle were larger in restrained rats than in controls for both ages at the beginning of the swing phase (G: knee at P30: t = 6.14; d.f. = 20; P < 0.0001; ankle at P30: t = 3.04; d.f. = 20; P < 0.01). H. Footprints of controls and SMR rats during gait in a walkway at P30. I. Plots of foot contact values in the walkway in control and SMR rats. The maximal foot contact area during weight bearing of SMR rats was much smaller than that of controls at P30 (U = 0; P < 0.001), even when the area was normalized relative to each rat's weight (U = 6; P < 0.01). The weight load of rats or foot contact intensity did not differ between both groups. After individual weight normalization, the relative mean intensity was greater in restrained rats compared with controls at P30 (U = 0; P < 0.001). Mean ± SD. Note that all kinematic values as well as footprint data are indicated in Supporting Information Table S1. LH, left hind limb; RH, right hind limb. P‐values: *, P < 0.05; **, P < 0.01; ***, P < 0.0001, SMR compared with control condition; a, P < 0.05; b, P < 0.01; c, P < 0.0001, P65 compared with P30.
