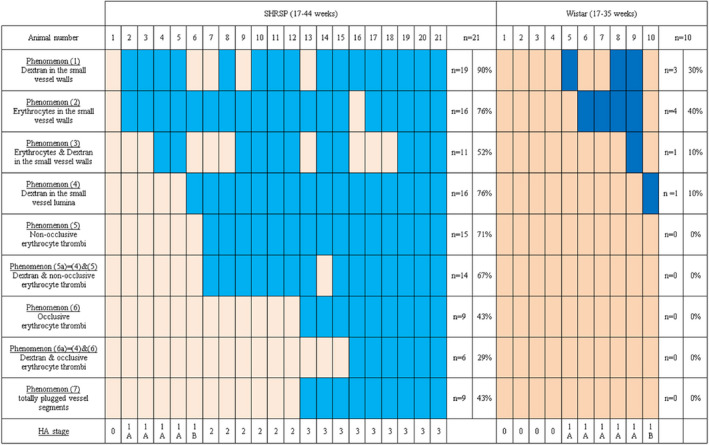
Figure 3.

Prevalence of HA phenomena and HA stages in each individual SHRSP and Wistar rat detected by in vivo imaging. All n = 21 SHRSP and n = 10 Wistar rats that underwent in vivo imaging were evaluated for the occurrence of HA phenomena (1)–(7) and the resulting HA stages. The light and dark blue boxes indicate the existence of single HA phenomena, while the light and dark beige boxes display that a certain HA phenomenon was not detectable in one individual rat. Absolute and relative numbers of rats that were positive for the distinct HA phenomena are given in the outer right columns. HA, hypertensive arteriopathy.
