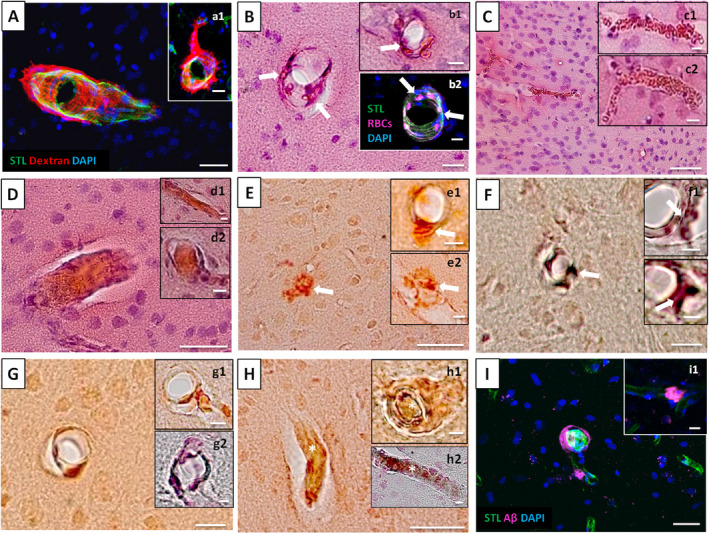
Figure 6.

Spectrum of post‐mortem HA and amyloid pathology in SHRSP. A and a1 display Dextran accumulations in and surround the small vessel walls indicative of BBB breakdown and B, b1 and b2 show the accumulation of erythrocytes in the small vessel walls (arrows). C, c1 and c2 demonstrate non‐occlusive erythrocyte thrombi and D, d1 and d2 show totally obstructed vessel segments. E, e1, e2, F, f1, f2 demonstrate dyshoric CAA with amyloid spreading from the vessel wall into the perivascular tissue (arrows in E, e1, e2, F, f1, f2), while G, g1, g2, H, h1, h2, I, and i1 display wall adherent Aβ accumulations both indicating CAA. Totally obstructed vessel segments within CAA‐positive small vessels are shown in H, h1, and h2 (asterisks). CAA, cerebral amyloid angiopathy; HA, hypertensive arteriopathy. HA data refer to the investigation of 21 and amyloid data to the investigation of 13 male SHRP aged 17–44 weeks. STL—solanum tuberosum lectin (endothelial marker), DAPI—4′.6‐diamidino‐2‐phenylindole (nuclear staining); A, a1, b2, I, i1—Immunohistochemistry, B, b1, C, c1, c2, D, d1, d2—HE staining, E, e1, e2, G, g1, H, h1—CR/Prussian blue staining, F, f1, f2, g2, h2—Thioflavin T/Prussian blue staining; scale bars: C‐E, H = 50 μm, A, a1, B, F, G, I = 20 μm, b1, b2, c1, c2, d1, d2, e1, e2, f1, g1, g2, h1, h2, i1 = 10 μm, f2 = 5 μm; age of the animals: C, c1, e1, G—18 weeks (w), H—28w, a1, c2, E, e2, h2, i1—32w, f2, g2, I—33w, B, b2—39w, A, b1, D, d1, d2, F, f1, g1, h1—44w
